What Revenue Analysis Misses About B2B SaaS Growth
TL;DR: Revenue analysis is good at pointing to the stage, segment, or channel where revenue stalls. It's worse at explaining the cause, and the most common cause isn't in your funnel at all. You're reaching the right companies at the wrong moment. The fix is to read the buying situations hiding in your closed-won deals, the recent changes that made past buyers ready to act. Here's how to do that.
Most revenue analysis tells you where deals slow down inside the funnel. It rarely tells you the real reason growth is stuck, which usually sits before the funnel entirely: you're reaching good-fit companies at the wrong moment. The clearest way I've ever seen that lesson had nothing to do with software.
Years ago, I was selling yarn. Almost nobody wanted to buy yarn.
So we stopped trying to sell it. Instead we ran free knitting workshops where you'd make your own bag, and the yarn was just what you needed to finish it.
People started buying.
The product didn't change. The audience didn't change. The situation did.
I've watched the same thing play out in B2B SaaS ever since. The easiest deals don't close because a company matches your ICP. They close because something just changed at that company, and for a short window, they have a reason to act.
That window is what most revenue analysis can't see. It measures what happens to deals inside the funnel, but the deal is often won or lost before it ever gets there. No dashboard tracks timing.
In B2B SaaS, that's where growth quietly gets stuck. Not in a stage you can fix, but in a window you keep missing.
What is revenue analysis?
Revenue analysis means looking at your marketing, pipeline, and closed-won data together, from first touch to closed deal, to see where revenue gets made, where it stalls, and where it slips away.
In B2B SaaS it pulls from three places:
- Marketing data. Traffic and channels
- CRM data. Pipeline and deal stages
- Closed-won data. What actually generated revenue
Done well, it answers questions a single dashboard can't: which channel brings revenue, not just leads. Where deals stall by segment. Which customers were worth winning.
Done poorly, it's a clean chart that describes the past without explaining it.
How to do a revenue analysis, starting with the funnel
Most teams run a revenue analysis in five steps: map the funnel, find the drop-offs, segment the win rate, tie channels to revenue, and check attribution. All five live inside the funnel. That's the right place to start, and in 2026 it's also only half the picture.
-
1
Map the funnel in real numbers.
Pull pipeline by stage, deal size, and total value. Your actual counts, not percentages from a benchmark deck.
-
2
Find the stage drop-offs.
Look for where deals stall. A funnel that looks healthy in aggregate often hides one stage where good-fit accounts quietly die.
-
3
Break win rate down by segment.
A blended win rate is the most misleading number in B2B. A “15% overall” rate can hide large deals closing at 0%, masked by a high small-deal rate.
-
4
Connect channels to revenue, not leads.
The channel with the worst cost-per-lead is sometimes the one bringing your best buyers. You only see this by joining marketing source to closed-won.
-
5
Check attribution before you trust it.
“Direct” traffic and empty CRM source fields can make weak channels look strong. When Direct traffic climbs above ~30%, that's usually a tracking problem, not brand strength. And even with good tracking, expect 15–25% of conversions to stay unattributed.
This gives you a map of where revenue is stuck. Real work, worth doing.
But it has a ceiling, and in 2026 that ceiling is lower than it used to be. According to 6sense's 2024 Buyer Experience Report, 81% of buyers have picked a winning vendor before they ever talk to a sales rep. And Forrester's 2026 “GTM Singularity” research reports 94% of B2B buyers now use generative AI in their buying process, which means most of their research happens on AI surfaces you never see. So when your five-step analysis comes back clean but growth is still flat, the cause usually isn't in the five steps. It's upstream of them.
That's the second half of the method, and it's where the rest of this article goes. Reading the buying situations in your closed-won deals.
Where standard revenue analysis breaks
Standard revenue analysis breaks because it only looks inside the funnel. It assumes the right companies are already entering, and asks only what happens to them after they arrive. So it can't catch the bigger problem: when the wrong-timed accounts are being fed in to begin with. The funnel looks fine; growth still stalls.
You can reach a perfect-fit account and still lose, simply because you reached it before or after the moment it was ready to buy. No stage report flags this, because the account never entered the funnel in its buying window.
What makes an account ready is a recent change at the company:
- A legacy system stopped scaling
- A team entered a new market
- A new company was building its stack from scratch
- A revenue leader got hired
- A team got funded
That change is the buying situation. It's the difference between a company that fits your profile and one that fits and has a reason to act now.
This is also why dashboards so often disagree with each other, the signal that matters lives between them. More on that in Funnel Analytics for B2B SaaS Founders Tired of Dashboards That Don't Agree.
ICP tells you who could buy. A buying situation tells you who buys now.
Firmographics tell me who could buy. Industry, company size, funding stage. We start there because it's easy to extract. But it's only part of the story.
Two companies can look identical in your ICP. Same size, same market, same funding stage. One is ready to buy this quarter. The other won't care for a year.
The difference isn't the profile. It's the situation.
| Question | What answers it |
|---|---|
| Who could buy? | Your ICP. Industry, size, funding stage |
| Why now? | A buying situation, a recent change that creates urgency |
| Who should we contact today? | Both, together. Fit and timing |
A firmographic list ages the day you export it. A view built on situations renews itself as the market moves.
So I don't stop at “which segment converts?” I start with closed-won and ask: what situation were my best customers in the moment they bought?
Who they are is the list. When they buy is the deal.
Most pipeline problems that look like funnel problems are actually timing problems.
How to find buying situations in your closed-won
To find buying situations, reverse-engineer them from deals that already closed. Pull your won accounts, record what changed at each company the month it bought, and look for the trigger that repeats across your best deals. That recurring trigger is the buying situation. You don't find it in a workshop, you find it in the data.
-
1
Pull your last 12–24 months of closed-won deals.
Not your ICP slide. The actual won accounts.
-
2
Capture what changed the month they bought.
Not just firmographics, but the trigger. Two kinds matter:
- Events. Did they raise funding, hire a revenue leader, switch tools, enter a market, hit a scaling wall?
- Behavior. Did they visit pricing or integration pages repeatedly before the sales conversation?
-
3
Look for the repeated situation, not the repeated company type.
Three fintech companies of similar size is a firmographic pattern. Three that all just closed a Series B is a buying situation, and that's the one you can act on.
-
4
Turn the recurring event into a signal you can watch for.
A funding round becomes a watch on funding databases. A leadership hire becomes a watch on job postings. A tool migration becomes a tech-stack change you can monitor.
-
5
Monitor the market for companies entering that situation.
Now you prioritize accounts in their window instead of blasting a static list and hoping the timing lands.
This is where revenue analysis stops being a report and becomes a targeting system.
For the full method on deriving your ICP from won deals instead of a workshop, see An Ideal Customer Profile Framework for B2B SaaS.
A revenue analysis example, funnel vs closed-won
Here's a revenue analysis example where the funnel and closed-won tell opposite stories. A founder runs the standard analysis and the funnel looks clean: stages convert, win rate sits at 18%, channel costs look fine. By every dashboard, nothing's broken.
But new revenue is flat.
Illustrative scenario, not a specific account.
So we run the closed-won half. Pull 18 months of won deals. The firmographics are unsurprising. Mid-market, fintech and healthtech, Head of Finance as the buyer. Correct, but inert.
Then we add the missing column: what changed the month each deal closed.
Eleven of the fifteen best deals closed within 90 days of the company either raising a round or hiring a finance leader.
That's not a firmographic. That's a buying situation.
Now the flat growth makes sense. Outbound was working a static list with no regard for timing, so it reached most accounts outside their window, too early or too late. The funnel converted the few that happened to land in-window and looked “healthy” doing it.
The fix isn't more traffic or a new stage. It's re-sequencing outreach around funding events and finance hires.
Same ICP. Different timing. Different revenue.
Is it a funnel problem or a timing problem?
To tell a funnel problem from a timing problem, look at where deals actually die. If good-fit accounts enter the pipeline and then stall at the same stage, that's a funnel problem, fix the stage. If good-fit accounts barely enter at all, or enter and go cold for no clear reason, that's a timing problem, you're reaching them outside their buying window. Conversion fixes won't touch the second one, because the deal was lost before it ever reached a stage.
A clean funnel with flat growth is the classic tell. Nothing inside the pipeline looks broken, because the problem was upstream of it.
That's the gap LamparaLab is built for: it reads your closed-won deals for the situation each buyer was in, then watches the market for companies entering the same situation.
For more on turning revenue reports into decisions instead of dashboards, see Revenue Reports Don't Lead to Decisions, and How I Use SPICED to Fix That.
Common questions
Why is my pipeline flat when the funnel looks clean?
Usually because the problem is upstream of the funnel. Your stages convert, your win rate is fine, your channels work, and growth is still flat because you're reaching good-fit accounts outside their buying window. The funnel can only measure deals that already entered it. It can't show you the accounts you reached too early or too late. When every funnel metric looks healthy but revenue won't move, the constraint is almost always timing, not conversion.
Why aren't my good-fit accounts converting?
Fit and timing are two different things, and most targeting only solves for fit. A company can match your ICP perfectly on industry, size, and funding stage and still have no reason to buy right now. What turns a good-fit account into a buyer is a recent change, a funding round, a new revenue hire, a tool migration. Without that trigger, even a perfect-fit account sits cold. So accounts don't fail to convert because your ICP is wrong about who. They fail because the outreach reached them at the wrong when.
What is a buying situation?
A buying situation is a recent change that temporarily raises a company's likelihood of buying, like a funding round, a new revenue hire, a tool migration, a market expansion, or a scaling problem. It's the difference between a company that fits your profile and one that fits and has a reason to act now. Firmographics tell you fit. The buying situation tells you timing.
How much of my pipeline was never going to close?
More than most teams expect, and it's rarely a sales problem. When a large share of pipeline stalls or dies for no clear reason, the usual cause is that those accounts entered outside their buying window, good fit but wrong moment. The way to find out is to compare your stalled deals against your closed-won ones. If your wins share a trigger that your stalled deals lack, the gap isn't your sales process. It's that the pipeline was filled on fit alone, with no read on timing.
What's the difference between revenue analysis and revenue analytics?
Analysis is the digging. You ask one question, “where is revenue stuck?”, and chase the answer. Analytics is the setup around it, the data, dashboards, and tools that let you ask again next month without starting over. Analysis is the work; analytics is the machine that makes the work repeatable. A team can have strong analytics and still run weak analysis, because dashboards don't produce insight on their own.
How do you do a revenue analysis in B2B SaaS?
In 2026 a revenue analysis has two halves. The first is the funnel half. Map the funnel in real numbers, find the stage drop-offs, break win rate down by segment, connect channels to closed-won revenue, and check attribution before trusting it. The second half is the one most teams skip. Since most buyers now decide before they ever enter your funnel, you analyze your closed-won deals to find the buying situation that made each one ready to act, then target other companies entering that same situation. The funnel half shows where revenue leaks. The closed-won half shows whether you're reaching the right accounts at the right moment.
Read next
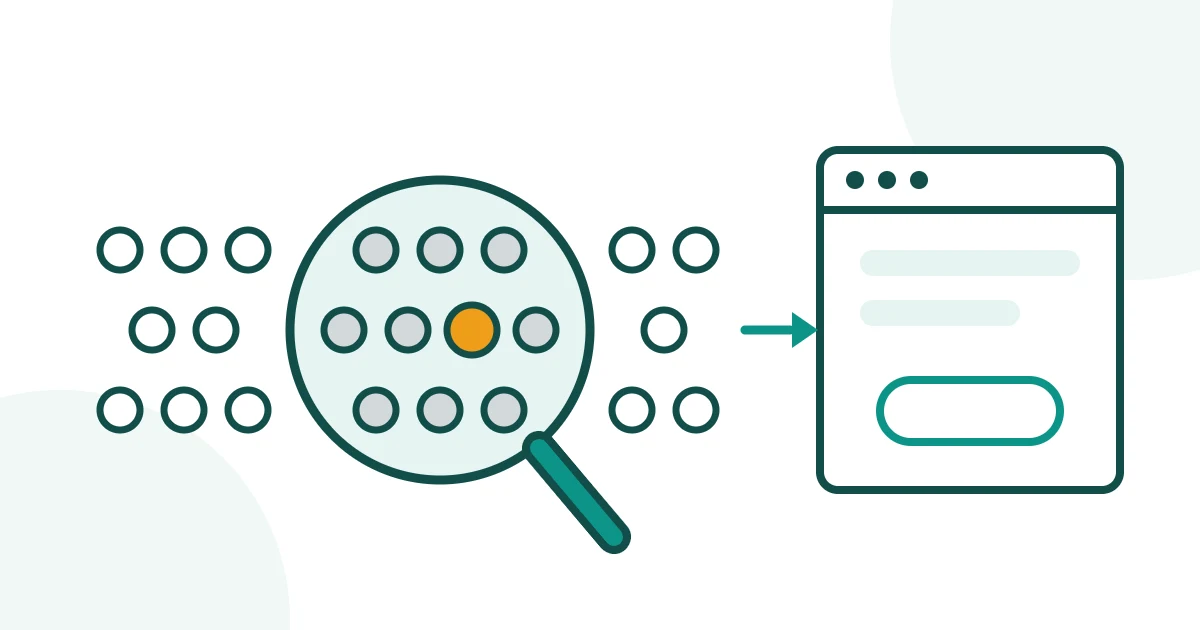
How to Convert More B2B SaaS Traffic Into SQLs
Traffic up, leads flat? Before rewriting the homepage, check who's reading it: a 30-minute Search Console audit, a buyer-by-buyer site read, an ICP fit test.
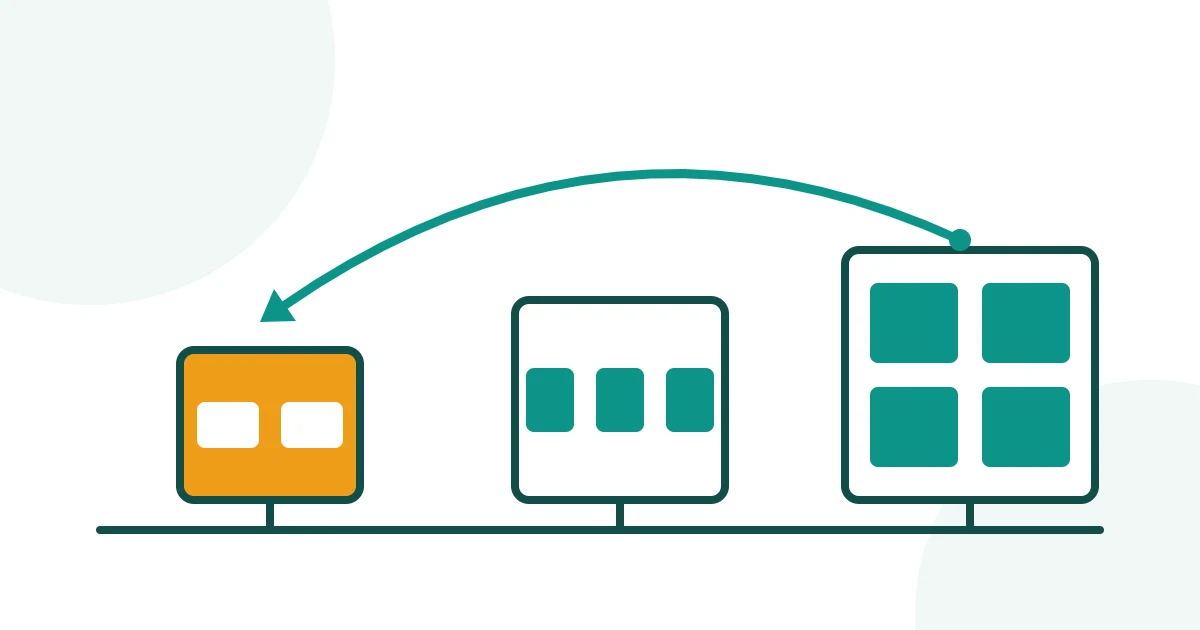
ICP Competitor Analysis: Why Customer Lists Mislead
Competitor customer lists show who buys today, not how they were won. What 135 customer records across 15 B2B sellers revealed. Here's the rewind.