An Ideal Customer Profile Framework for B2B SaaS: Why Customer Journey Analysis Needs to Start From Revenue, Not Traffic
TL;DR: Most customer journey analysis in B2B SaaS starts from traffic — personas, touchpoints, hypothetical paths. The problem: it rarely matches who actually buys. An ICP-to-Revenue Journey reverses the process. Start with Closed Won deals, identify the ideal customer profile from real revenue data, then connect behavioral signals from GA4 to that ICP backward. This turns customer journey mapping from a workshop artifact into a system grounded in who actually buys.
Customer journey mapping was built for a different era. When acquisition was the bottleneck in B2B SaaS, getting someone to your site meant you'd already won half the battle. It made sense to focus on the top of the funnel.
That's not the reality anymore. Channels are abundant, attribution stacks exist, leads aren't the problem. The bottleneck moved down — it's conversion to revenue now. But the methodology stayed the same.
The framework below is how I structured customer journey analysis differently, while building the diagnostics methodology for LamparaLab: start from Closed Won, work backward.
A customer journey map is a hypothesis. Your Closed Won deals are evidence.
Why customer journey mapping breaks in B2B SaaS
Customer journey mapping is still standard practice in B2B SaaS. But it systematically fails in four ways: it maps one buyer when B2B has a buying committee, it's built on hypotheses instead of Closed Won data, it exists as a static artifact instead of an updating system, and it reflects an era when acquisition was the main constraint.
It maps one buyer, but B2B has a buying committee
Most customer journey maps draw one user with a linear path. In reality, B2B SaaS buying involves at least 3–5 roles: the initiator, the user, the economic buyer, sometimes security or legal.
HubSpot shows this clearly: Closed Won deals often have multiple contacts with different roles and motivations. But mapping ignores this complexity and simplifies the system into one line. You lose critical context — who actually makes the decision.
It's hypothesis-based, not revenue-based
Traditional customer journey mapping is built through workshops, interviews, assumptions. That's useful early on, but the problem is the map stays a hypothesis.
Closed Won data is the only source of truth about who actually buys. If your mapping isn't validated against this data, you're optimizing marketing for people who don't convert to revenue.
It's a workshop artifact, not a system that updates
Customer journey mapping typically lives as a document — slides or a Notion page. It gets updated quarterly, if at all.
But B2B SaaS is a dynamic system: new deals close, new segments emerge, ICP shifts. If the map doesn't update automatically based on new Closed Won deals, it goes stale fast.
It was built for an era when acquisition was the bottleneck
Mapping emerged when the main problem was driving traffic. Today's problem is different: you have traffic, but it doesn't convert to revenue.
Customer journey mapping carries this old shape forward. It optimizes the top of the funnel without checking which of those users actually become customers.
For more on why patterns moving revenue live between systems rather than inside any single dashboard, see Funnel Analytics for B2B SaaS Founders Tired of Dashboards That Don't Agree.
What an ICP-to-Revenue Journey is, and why it starts from Closed Won
An ICP-to-Revenue Journey is a B2B SaaS framework that analyzes the customer journey in reverse: starting from Closed Won deals to derive the ideal customer profile, then walking backward through pipeline velocity, lost deal diagnosis, and behavioral signals to find the patterns that actually produce revenue.
Instead of starting with traffic and trying to guess who might buy, the framework starts with people who already bought. This changes the entire logic of the analysis: from hypotheses to proven patterns.
Why the reverse order works
The top of the funnel in B2B SaaS is noisy. Random traffic, irrelevant leads, broken attribution.
The bottom is the cleanest signal you have. Closed Won deals are the actual output of your entire system. Start there, define your ideal customer profile first, then work backward to see where these people came from and how they behaved.
This turns customer journey analysis from guesswork into a system.
Mapping vs ICP-to-Revenue Journey
| Customer Journey Mapping | ICP-to-Revenue Journey | |
|---|---|---|
| Starts from | Buyer persona hypothesis | Closed Won deals |
| ICP source | Workshops and interviews | Patterns in Closed Won firmographics |
| Data layer | Qualitative narrative | HubSpot and GA4 combined |
| Buying model | Single linear buyer | Multiple roles from CRM |
| Channel-to-revenue link | Assumed | Tested through attribution gate |
| Output | Static document | Scoring card and sales playbook |
| Update cadence | Periodic | Trigger-based, refreshed as new deals close |
| Data gaps | Often ignored | Explicitly acknowledged |
ICP-to-Revenue Journey doesn't replace mapping entirely — it makes it testable. It's a shift from “map” to system, one that constantly validates against real revenue.
The ICP-to-Revenue Journey framework, step by step
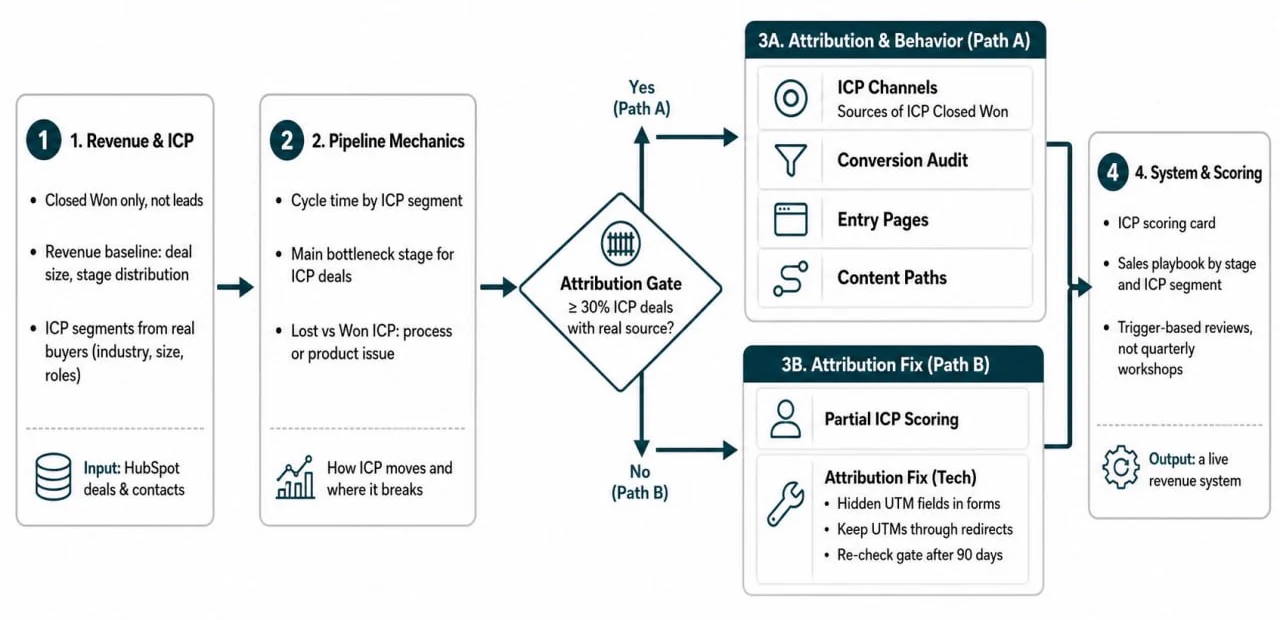
The framework has a specific architecture: HubSpot first (steps 0–4), then an attribution gate (step 4.5), then GA4 if the gate opens (Path A) or honest scoping if it doesn't (Path B).
This isn't arbitrary. HubSpot holds revenue truth — who bought, how much, how fast. GA4 holds behavioral signals — what people did on your site. But these systems don't connect directly. GA4 tracks anonymous users. HubSpot tracks named contacts. Step 4.5 determines whether you can reliably connect the two — and that decision changes the entire route of the analysis.
The framework works for a typical B2B SaaS setup — steady flow of deals, standard CRM, GA4 on the site. The analysis is directional, not exact attribution: the HubSpot source → GA4 behavior link is used as a directional signal, not user-level attribution. Edge cases get handled at implementation.
Steps 0–4: HubSpot first
| Step | Why this step | What you do → what you get |
|---|---|---|
| 0. Data audit | Before interpreting data, you need to know how much you can trust it. This is a general diagnostic of the database. The gate to GA4 is a separate question — that's Step 4.5. | Check three things. First: if more than 60% of contacts have no real source, attribution is systemically broken. ⚠️ OFFLINE isn't always wrong — it covers manual imports, API loads, deals created by sales. Unusable for marketing attribution, but not necessarily incorrect data. Second: are there double-counted events in GA4 — note which duplicates to clean in Step 6A. Third: how filled are the profile fields. If industry is empty for most contacts, the ICP in Step 2 will be incomplete. → A trust map for your data: what you analyze directly, where you need workarounds, what needs fixing. |
| 1. Revenue baseline | Start with the money. Deal size and distribution set the coordinate system for everything else: which buyer is “right,” what cycle is normal, which channels can even pay back. | Look at deal count and average amount across each pipeline stage. Look for anomalies — for example, if the average Won deal is smaller than the average Lost deal, the big ones are slipping, and that changes the priorities of the whole analysis. → Target deal size and the first funnel anomalies. |
| 2. ICP profile | Only after you know the size of the money do you go look at who brought it. Take Closed Won deals only — that's the one source of truth about your buyer, not hypotheses. The output of this step becomes the filter for every step that follows. | Look for the repeating pattern among buyers. Define 2–3 segments with explicit criteria — for example, “SaaS companies 50–200 employees, VP of Marketing.” ⚠️ Job title is often inconsistent — group manually. → 2–3 ICP segments with clear criteria. From here on, “ICP” means these segments specifically, not just “all Closed Won.” |
| 3. Pipeline velocity | This step comes after Step 2 intentionally: cycle time is calculated per ICP segment, not across all Closed Won. Cycle defines channel economics — a company that closes in 30 days instead of 90 can produce more annual revenue even with fewer leads. | Take Closed Won and Closed Lost separately, filtered by ICP segments from Step 2. Look at average cycle time per segment. Look at which stage deals stall or die at most often. → Normal cycle length per ICP segment, and the funnel bottleneck. |
| 4. Lost deal diagnosis | Lost deals are qualified demand that didn't convert. Compare ICP-shaped Lost with ICP Won — not all Lost with all Won — otherwise you mix different company types and get a false diagnosis. | Filter Closed Lost for firmographics matching the ICP from Step 2. Compare with Won on the same fields. If profiles are identical — process or product problem. If there's a systematic difference — it's a different type of company the product doesn't yet close. → Diagnosis: process issue or product issue. HubSpot analysis ends here. |
The fork (Step 4.5)
| Step | Why this step | What you do → what you get |
|---|---|---|
| 4.5. 🔀 Attribution gate | You know who the ICP is. The targeted question now — not about the whole base like Step 0, but specifically: does HubSpot know where the ICP buyers came from? The answer changes the entire route. | Take ICP Closed Won deals only. For each, check the source on the primary contact (Original Source or hs_analytics_source, depending on CRM setup). Count what share has a real source — not DIRECT_TRAFFIC, not OFFLINE, not empty. Threshold: ≥ 30% → Path A. < 30% → Path B. The 30% is a working assumption: below that, the sample is too biased for channel-level conclusions. → Two routes. |
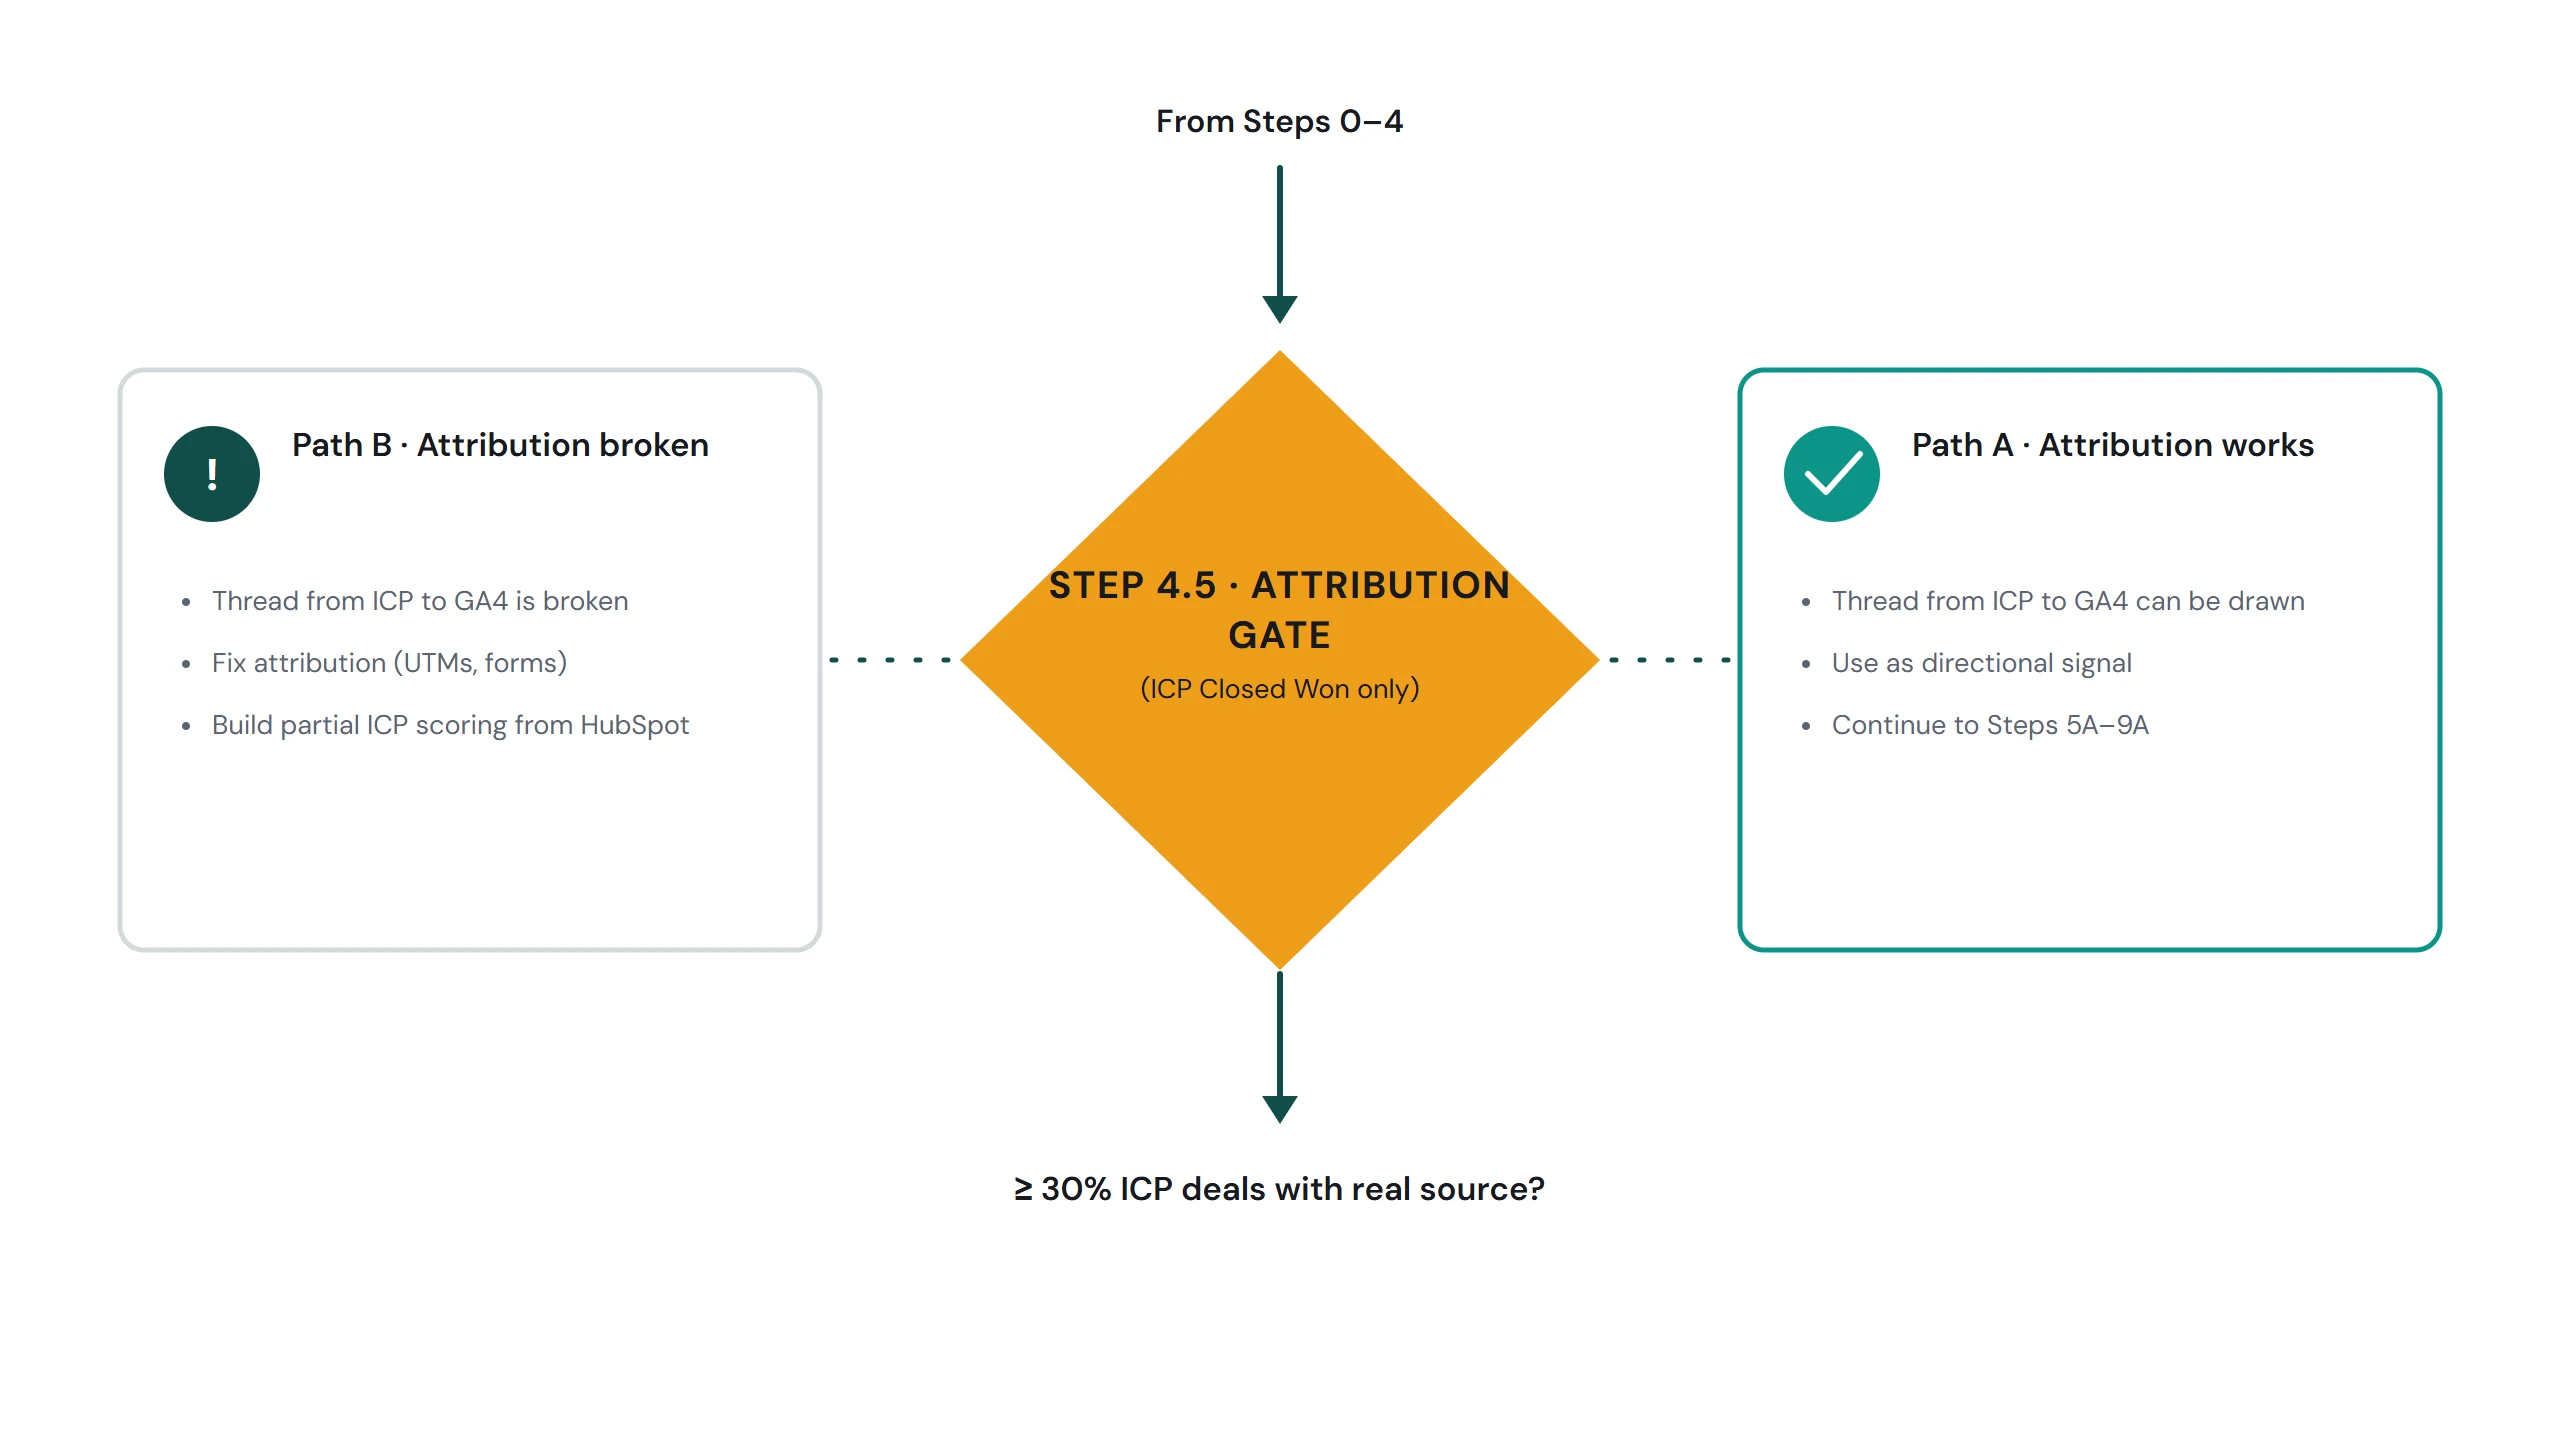
Path A — attribution works
| Step | Why this step | What you do → what you get |
|---|---|---|
| 5A. ICP source mapping | Take the sources of ICP buyers and bring them into GA4 — this is the only way to indirectly link a named buyer to anonymous behavior on the site. | For each ICP Closed Won deal, take the source on the primary contact. The primary contact is the one marked as decision-maker; if that field isn't filled, use a documented fallback rule agreed with the team. Compile a list of channels: e.g. Organic Search, Paid Social, Referral. ⚠️ Source labels in HubSpot and GA4 don't match directly — use this list as a direction for GA4, not as a precise filter. → A list of ICP channels to filter GA4 by. |
| 6A. Conversion audit by ICP channels | Before counting conversions, eliminate the double-counting noted in Step 0. Without cleanup, conversions appear doubled and channel conclusions go wrong. | Find pages where one user action gets logged as multiple events. Keep one primary event per page, exclude the rest. Count clean conversions per ICP channel. → An honest conversion table by ICP channel, without duplicates. |
| 7A. Entry points by ICP channels | You have real numbers — now look at where on the site people coming through ICP channels actually convert. | Pull conversion pages filtered by ICP channels from Step 5A. Compare with the all-channel picture. If a page converts well overall but poorly for ICP — content doesn't land with your audience. If it converts only for ICP channels — it's a valuable asset worth amplifying. → A map of pages that convert ICP traffic. |
| 8A. Content path by ICP channels | You know where ICP buyers convert — now look at how they got there. Which pages people coming through ICP channels viewed before submitting the form. This is a pattern you can reproduce and scale. | Look at the pages people coming through ICP channels visited before a conversion event. Look for repeating sequences — the “warming” path for your ICP. Read the pattern across the sample, not individual visits. → A warming content path for ICP. This becomes the content plan: improve these pages, promote them, add to nurture. |
| 9A. ICP scoring & playbook | This closes the loop. You started with “who already bought” — you finish with “how to recognize the next one and what to do with them.” Without this step, the framework stays a report. If Path B was completed first, don't rebuild — add the channel layer on top of the existing card from Step 6B. | Build a scoring card: who fits by profile + which channel they came from + which pages they viewed. Build a playbook for sales: what to do at each stage, given the bottleneck from Step 3 and the diagnosis from Step 4. → A full scoring card + sales playbook. A system that runs without an analyst in the loop. |
Path B — attribution broken
When the gate stays closed, the framework doesn't continue into GA4. But the work done in Steps 0–4 already produces value, and the attribution fix runs in parallel.
Step 5B isn't an analysis step. It's a task for the engineering team. It runs alongside Step 6B, not before it.
Step 5B — Technical fix (engineering task)
Add hidden UTM fields to every form on the site: utm_source, utm_medium, utm_campaign read from URL and pass into HubSpot as contact properties when the form submits. Check that post-form redirects don't strip UTM parameters. After 90 days, return to Step 4.5 and recheck the threshold.
| Step | What you do | What you get |
|---|---|---|
| 6B. Partial ICP scoring (firmographic only) | Build a scoring card based on Steps 2, 3, 4: ICP profile + cycle time + loss diagnosis. The channel and content layer stays empty until attribution is fixed. 6B = Step 9A minus the channel layer. When attribution returns, don't rebuild — take this card and add the channel layer in Step 9A. | A partial scoring card — sales already knows who to qualify and how to move them through the funnel. Channel recommendations get added later. |
Framework review cadence
The framework runs on trigger logic — three events prompt a partial review.
| Trigger | What you review | What you don't touch |
|---|---|---|
| A meaningful number of new ICP deals closed | Step 2 — refresh the ICP profile. Step 3 — recalculate cycle time. Step 9A — update the scoring card. | Steps 0 and 1 — only if new data sources appeared. |
| Attribution fixed (Path B → Path A) | Step 4.5 — recheck the threshold. If ≥ 30% — run Steps 5A–9A and add the channel layer to the Step 6B card. | Steps 0–4 — no review unless the base changed. |
| New channel or campaign launched | Steps 6A–8A — add the new source to behavioral analysis. | ICP profile and cycle — don't touch until new ICP Closed Won come through this channel. |
A short illustration
Here's a typical pattern. A B2B SaaS founder sees 200 conversions per month in GA4 but only 15 deals close. The instinct is “we need more traffic.” The framework shows something else entirely.
(Illustrative scenario, not from a specific account.)
Start with Closed Won (step 2). Of the 15 deals, 12 are mid-market companies in fintech and healthtech, average deal $18K. Job titles cluster around Head of Finance and VP Operations.
Check attribution (step 4.5). Only 5 of those 15 have real source in HubSpot. The rest show DIRECT_TRAFFIC or OFFLINE — attribution is broken. You're on Path B.
While the technical fix runs (step 5B), you can still score by firmographics (step 6B): prioritize inbound leads from fintech/healthtech, 50–200 employees, Finance or Ops roles. Sales now qualifies faster without waiting for channel data.
After 90 days, attribution coverage hits 40%. You move to Path A. ICP Source Mapping (step 5A) shows most Closed Won came through ORGANIC_SEARCH and REFERRALS. Entry Points (step 7A) shows they convert on the pricing page and a specific ROI calculator page — not the homepage.
Content Path (step 8A) reveals a pattern: they read a case study, then hit the calculator, then pricing, then convert. That's your warming sequence.
The Playbook (step 9A): prioritize SEO for case study content, promote the calculator in nurture emails, add firmographic scoring to lead routing.
The problem wasn't “not enough traffic” — it was not recognizing the right traffic. The Closed Won data was always there. The framework just made it the starting point.
How AI reads GA4 and HubSpot together — and what it can't see
Running customer journey analytics across HubSpot and GA4 manually is the kind of work that eats a senior analyst's week. You export tables, join them in spreadsheets, look for patterns by eye. AI changes the speed — but it doesn't change the structural limitation.
What AI does well across GA4 and HubSpot
AI can read both systems as one cross-system signal. It spots patterns faster than manual analysis: which hs_analytics_source values correlate with higher deal size, which GA4 conversion pages appear most often in Closed Won sessions, where behavioral signals from GA4 align with HubSpot firmographics.
It handles the volume problem. If you have 500 Closed Won deals and 50K GA4 sessions, manually tracing ICP channels through conversion paths isn't realistic. AI does it in seconds.
It surfaces anomalies you wouldn't look for. A specific UTM campaign that converts at 2% overall but 12% for your ICP profile. A page that gets low traffic but high conversion from the exact company size that closes fastest.
What it can't see, even with both systems connected
AI can't invent missing data. If HubSpot shows DIRECT_TRAFFIC for most of Closed Won, no amount of AI analysis will tell you the real channel. The attribution gate (step 4.5) exists because this is a data infrastructure problem, not an analysis problem.
It can't see buying committee dynamics. HubSpot records multiple contacts per deal, but GA4 doesn't know which anonymous session belongs to which role. You can see that a deal involved a CFO and a VP Ops, but you can't trace which pages each person visited unless you have advanced identity resolution — which most B2B SaaS don't.
It can't see the dark funnel. Podcast mentions, Slack communities, word-of-mouth referrals — none of this shows up in GA4 or HubSpot attribution. If your ICP discovers you outside trackable channels, the framework will undercount that channel's impact.
That's why the ICP-to-Revenue Journey is built with these gaps in mind. Path B exists because broken attribution is normal. The framework tells you what's reliable and what isn't — instead of pretending every data point has equal weight.
For more on how AI agents handle missing data honestly instead of inventing answers, see Why Connecting Claude to HubSpot and GA4 Gives Wrong Revenue Answers.
From customer journey mapping to a system that updates itself
Customer journey mapping is a fixed document. You create it in a workshop, put it in slides or Notion, reference it for a quarter, maybe update it later.
The ICP-to-Revenue Journey is a system that recalculates your ideal customer profile every time a new deal closes. It's not a map — it's live navigation.
When a new Closed Won comes in, the ICP profile (step 2), pipeline velocity (step 3), and lost deal diagnosis (step 4) all update. On Path A, the ICP source mapping and content path refresh with the latest data. The scoring card and playbook (step 9A) evolve as the customer base evolves.
Dashboards made the same shift years ago — from quarterly reports to real-time systems. Customer journey analysis should follow. A static map made sense when data was expensive to collect. Now that GA4 and HubSpot run continuously, your understanding of the customer journey should too. The system isn't fully self-updating — it's a structured review that gets rerun on triggers. But the logic stays the same, and the rerun takes hours, not a workshop quarter.
For a similar shift from static reports to decision-driven analysis, see Revenue Reports Don't Lead to Decisions — How I Use SPICED to Fix That.
Common questions
What is customer journey analysis in B2B SaaS?
Customer journey analysis in B2B SaaS is the practice of tracing how prospects move from first touch to closed deal across the systems that record their behavior — web analytics, CRM, ad platforms. It's distinct from customer journey mapping, which describes that path through workshop-derived hypotheses. Analysis works with data; mapping works with assumptions. In a B2B SaaS context, where the buying committee involves multiple roles and the path is non-linear, analysis is what produces actionable conclusions. Mapping produces a document.
How does customer journey analytics work with HubSpot?
HubSpot tracks named contacts, deal stages, and source values across the sales pipeline. Customer journey analytics on HubSpot uses this to answer revenue questions: who actually closes, how long the cycle takes, where deals stall, what firmographics define your ICP. It doesn't track anonymous behavior on your website — that lives in GA4. The two systems join indirectly through source fields. Reliable joining requires UTM tracking that survives form redirects, and contact properties that get filled consistently. Without that, channel-to-revenue conclusions stay directional, not exact.
How is the ICP-to-Revenue Journey different from customer journey mapping?
Customer journey mapping starts with a buyer persona hypothesis and walks forward through Awareness, Consideration, Decision, Purchase. The ICP-to-Revenue Journey starts with Closed Won deals and walks backward — deriving the ideal customer profile from real revenue, then connecting backward through pipeline, attribution, and behavioral signals. Mapping is a fixed document. The Journey is a system that recalculates as new deals close. Mapping treats data gaps as silent. The Journey has an explicit attribution gate that says “we don't know” when the data doesn't permit a channel-level answer.
What is an ideal customer profile framework?
An ideal customer profile framework is a structured method for identifying which buyers your product actually closes. It produces firmographic criteria — industry, company size, role of the decision-maker — that filter your pipeline analysis. The traditional approach builds the ICP from interviews and assumptions. The ICP-to-Revenue Journey builds it from Closed Won data: the 2–3 segments that show up repeatedly in real revenue, with explicit criteria documented. From there, every downstream analysis — pipeline velocity, lost deal diagnosis, behavioral signals — gets filtered by ICP, not run across all leads.
Can I run an ICP-to-Revenue Journey without an attribution stack?
Yes — and that's by design. The framework runs entirely on HubSpot and GA4, with no separate attribution infrastructure required. The attribution gate (step 4.5) checks whether HubSpot's first-touch source is reliable enough for channel-level conclusions. If it is, you continue into GA4 and connect behavioral signals to ICP. If it isn't, you build a partial scoring card from firmographics alone and run a technical fix to restore attribution over 90 days. Either way, the framework produces a usable output — not a dependency on an enterprise attribution platform.
Read next
How to Convert More B2B SaaS Traffic Into SQLs
Traffic up, leads flat? Before rewriting the homepage, check who's reading it: a 30-minute Search Console audit, a buyer-by-buyer site read, an ICP fit test.
ICP Competitor Analysis: Why Customer Lists Mislead
Competitor customer lists show who buys today, not how they were won. What 135 customer records across 15 B2B sellers revealed. Here's the rewind.