Why Revenue Reports Don't Lead to Decisions, and How I Use the SPICED Framework to Fix It
TL;DR: A revenue report tells you what's happening. It rarely tells you what to fix first, or what fixing it is worth. I asked our AI agent to look at funnel data through the SPICED framework from Winning by Design. The same numbers came back as a short diagnosis instead of a flat list of metrics. Here's what changed and why it worked.
Pain without a price tag isn't a priority. It's a slide in a quarterly review.
At LamparaLab I run an AI agent that sits on top of GA4 and HubSpot data and answers questions about revenue. It's part of how we deliver Revenue Intelligence. Most of the time I ask it open questions like what changed last month, where are we losing leads, is this channel working — and the answers come back as findings, not as a plan.
A few weeks ago I tried something different. I asked: “What would this funnel look like through SPICED?”
The SPICED framework is a sales discovery framework from Winning by Design: Situation, Pain, Impact, Critical Event, Decision. Sales reps use it on discovery calls. I hadn't seen it applied to analytics, but three of the five letters (Impact, Critical Event, Decision) are exactly what funnel reports usually miss — a sense of what a problem is worth, why it's urgent, and how we'll know we fixed it.
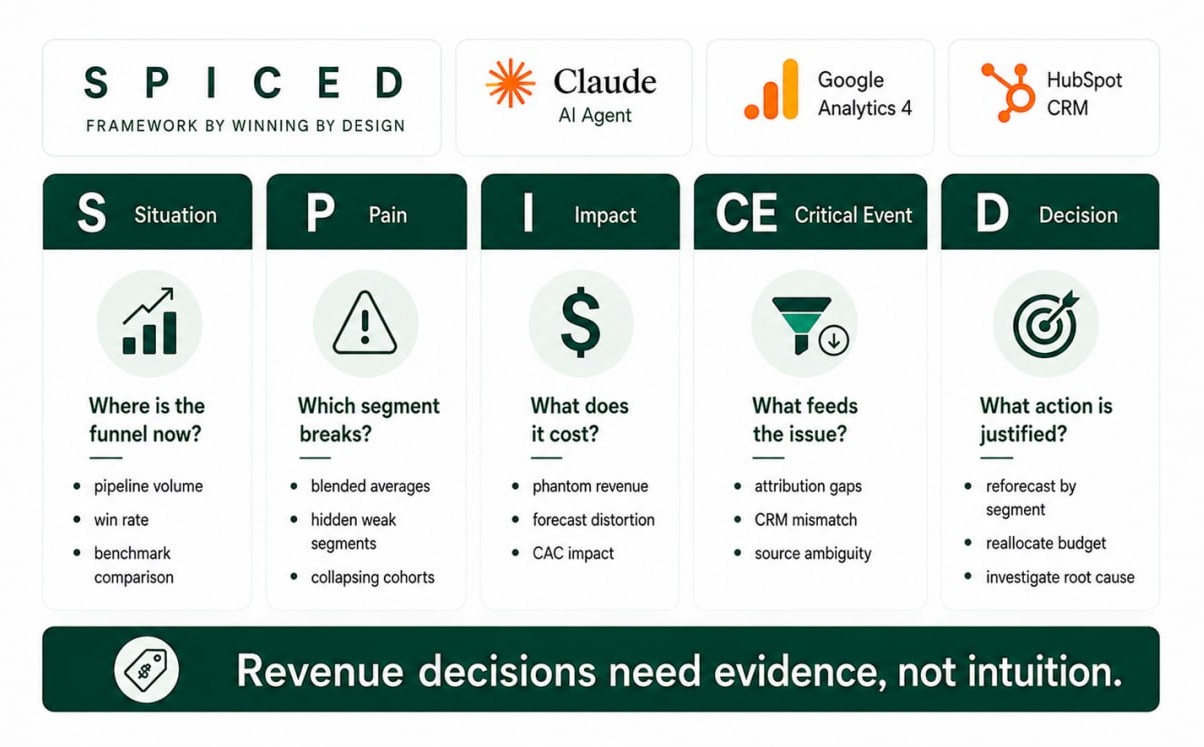
How the SPICED Framework Maps to Funnel Analytics
Same five questions, aimed at the dataset instead of at a prospect.
| Letter | Winning by Design (sales) | LamparaLab (analytics) |
|---|---|---|
| S — Situation | Facts, circumstances, and background about the prospect. | Where is the funnel right now? Total deals, win rate, pipeline volume vs. benchmark. |
| P — Pain | The challenges that brought the prospect to you. | What's hurting in the data once you stop averaging? Which segment? |
| I — Impact | How your solution impacts the prospect's business. | What does this pain cost us in dollars: phantom revenue, closed-lost, downstream effects on CAC and hiring. |
| C — Critical Event | The deadline by which the prospect needs the impact realized. | What's feeding the pain right now? Which channels deliver leads into the failing segment? |
| D — Decision | The process, committee, and criteria the prospect uses to buy. | What we do, and the data that justifies it. |
The shift that mattered: Decision in analytics isn't “what to do next.” It's what we do, with the data that justifies it sitting right next to it. That's the difference between a recommendation and a defensible decision.
Walking a B2B SaaS Funnel Through SPICED
This example walks SPICED all the way to D because the data permits linking channel, segment, and outcome. Further down I'll show what happens when attribution breaks — SPICED stops at C, and that's also a result.
Situation. Where Is the Funnel Right Now?
Pipeline: 280 deals. Closed: 132 (20 won, 112 lost). Win rate 15.2%, against a B2B SaaS median around 20%. This is what a standard revenue report would say. The dashboard stops here.
Pain. Which Segment Is Hurting?
Splitting closed deals by ACV:
| Segment | Won | Lost | Win Rate | Avg ACV (lost) |
|---|---|---|---|---|
| small | 14 | 52 | 21.2% | $6,499 |
| mid | 6 | 36 | 14.3% | $17,692 |
| large | 0 | 24 | 0.0% | $40,367 |
Illustrative data, not from a specific account.
The blended 15% is a hospital average. Small is at benchmark, mid is dragging, large is a collapse: zero wins out of twenty-four. Forecasting large on a blended rate is wrong. It's a different physics.
Impact. What Does This Cost Us?
Active large pipeline: 29 deals, $1.14M.
| Forecasting method | Win Rate | Forecast revenue |
|---|---|---|
| Blended “average 15%” | 15.2% | $173,912 |
| Historical large WR | 0% | $0 |
That's $173,912 of phantom revenue in the current forecast, on top of $968,799 already burned in closed-lost. The segment has consumed over a million dollars and produced zero closed deals.
That $173k isn't a reporting error to fix later. It's already wired into the board forecast, into next quarter's marketing budget (CAC is calculated against expected revenue), into sales hiring built on projected growth, and into OKRs with bonus attached. When the revenue doesn't show up, the gap gets patched with marketing cuts, hiring freezes, and an uncomfortable conversation with the board — not in the segment where it was born.
Critical Event. What's Feeding the Failing Segment?
GA4 shows 25 demo_request events for the period. Only 2 from LinkedIn Paid. So on paper, LinkedIn looks tiny.
It isn't. Large deals rarely come through a website form. They arrive through SDR outbound after a LinkedIn ad click, through LinkedIn Lead Gen Forms (a separate event GA4 doesn't track), through conferences, through partner referrals. The website form catches a fraction of the activity that produces large deals.
To see the real picture, the agent re-derived the source for each large deal, looking at the contact most likely to have originated it instead of relying on HubSpot's default inheritance. The result:
| Original source of large deals | Closed-lost | Active | Active pipeline $ |
|---|---|---|---|
| PAID_SOCIAL (LinkedIn) | 7 | 8 | $315k |
| OFFLINE (conferences, networking) | 6 | 9 | $356k |
| PAID_SEARCH | 4 | 5 | $198k |
| DIRECT_TRAFFIC | 5 | 4 | $158k |
| Other | 2 | 3 | $117k |
| Total | 24 | 29 | $1.14M |
Illustrative data, not from a specific account.
In HubSpot, LinkedIn is the original source for fifteen large deals. In GA4 it looked like two submissions. Same channel, two completely different pictures depending on which system you read.
LinkedIn Paid accounts for 28% of active large pipeline — the largest trackable channel feeding the segment. And zero wins: 7 of 7 already closed-lost. GA4 says LinkedIn leads convert to demo at 2%, so the channel works at the top of the funnel, but its leads stall later.
Decision. What Do We Do, and What Does the Data Say?
Four decisions, each tied to a number in the data.
-
1
Forecast by segment, not by blended rate.
Use segment-specific win rates (small × 21.2%, mid × 14.3%, large × 0%) until segment data says otherwise. Strips $173k of phantom revenue out of the current forecast. Revisit if large produces three consecutive closed-won.
-
2
A channel earns its scale.
No paid channel gets a budget increase until it produces a non-zero close rate in the segment it generates leads for. LinkedIn Paid fails this in large: 0 of 7 closed. Doubling its budget would grow LinkedIn-large pipeline from $315k to $630k; blended 15% forecasts +$47k, real expected revenue is zero. Marketing report: “LinkedIn doubled leads.” Revenue report six months later: “forecast missed again, by more.”
-
3
Re-budget toward channels with proven close.
Move the freed budget to channels showing actual wins in small and mid (where WR is at benchmark). Revisit if their CAC inflates.
-
4
A separate root-cause investigation owns the large question.
Why doesn't large close: pricing, ICP, sales process, competitor? Not a marketing question. Needs a closed-lost audit on the 24 lost deals.
Each decision points to the data that justifies it. That's what makes it a decision instead of a recommendation.
When SPICED Breaks: Diagnosing Attribution Gaps
That example worked because the data permitted it. Often how to diagnose a drop in leads for SaaS runs into a wall at C, and the rest of the framework becomes hypothetical. S, P, and I work the same way (overall WR below benchmark, large at zero, phantom revenue in forecast), then C falls apart on three problems:
- Deal source is often unreliable. HubSpot does set Original Source on the Deal object, but it inherits from the associated contact with the earliest activity (or from the company if no contact is associated). When contacts and companies aren't properly associated with deals, or when a deal is tied to an old contact whose first touch was years ago, the deal's source becomes either blank or misleading. Standard reporting can't reliably connect channel to outcome.
- Half the contacts have an unknown source. UTM gets stripped on form redirects; a large chunk of paid traffic collapses into DIRECT_TRAFFIC. The channel is bigger than the report says, but you can't tell by how much.
- One account, many sources. A B2B buying committee often includes multiple contacts per company, each from a different touch. The data shows an average of four different
hs_analytics_sourcevalues per company. “Where did this deal come from” doesn't have a single answer.
What this means for SPICED. Without GA4 ↔ HubSpot matching and without reliable source on the deal, any channel-to-outcome link is intuition. The decision here is infrastructure, not marketing: ensure contacts and companies are properly associated with deals, fix UTM handling on forms, run probabilistic matching by date and geography. Then return to C and D.
Meanwhile, S, P, and I alone already produce value. Re-forecasting by segment saves $173k of phantom revenue today, before the channel question can be answered.
SPICED doesn't break on strategy. It breaks on data. If step C can't be completed, that's not a framework failure — it's a signal that attribution is what needs fixing, not the funnel.
From Revenue Reports to Revenue Decisions
A while ago I wrote that dashboards are hygiene; pattern-finding is the work. The SPICED framework is one way to do that work systematically. Five questions over the same data, letting the structure pull the answer out instead of staring at a chart and hoping.
If your monthly review is still “open dashboard, read number, move on,” try walking one of your funnels through SPICED. You'll probably find something like the $173k phantom revenue from this example: a number sitting in your forecast right now, waiting for someone to ask the right question of it.
See how Revenue Intelligence works →
Common questions
What is the SPICED framework?
A sales discovery framework from Winning by Design: Situation, Pain, Impact, Critical Event, Decision. Five questions a sales rep walks through with a prospect to qualify a deal.
How does the SPICED framework apply to analytics?
The same five questions, aimed at funnel data instead of a person. They turn a list of metrics into a diagnosis with a price tag, a cause, and a decision pointed at the data.
Why don't most revenue reports lead to decisions?
Because they stop at Pain. A dashboard lists what's wrong but doesn't quantify it, connect it to channels, or define what justifies an action. SPICED forces all three: Impact (dollars), Critical Event (cause), Decision (an action with the data behind it).
What do I fix first in a sales funnel?
What has the largest Impact, traceable to a real Critical Event in the data. In most B2B SaaS funnels, segmenting by ACV and re-forecasting on segment-specific win rates is the first move. Costs nothing, exposes phantom revenue.
How do I diagnose a drop in leads for SaaS?
Walk SPICED. Situation: lead volume now vs. baseline. Pain: which channel and segment is dropping. Impact: pipeline dollars at risk if it continues a quarter. Critical Event: what changed (algorithm, campaign, attribution, form). Decision: rebuild, redirect, or wait, and the data that says so.
What's the difference between a revenue report and revenue intelligence?
A revenue report tells you what happened. Revenue intelligence tells you what to do about it, by connecting channel data to deal outcomes, surfacing forecast errors, and applying decision frameworks like SPICED. Chart vs. defensible decision.
Read next
Ideal Customer Profile Framework for B2B SaaS: The ICP-to-Revenue Journey
An ideal customer profile framework for B2B SaaS that reverses customer journey analysis — start from Closed Won deals, derive your ICP from real revenue, then connect HubSpot and GA4 backward to find the patterns that produce revenue.
Why Connecting Claude to HubSpot and GA4 Gives Wrong Revenue Answers and How Context Engineering Fixes It
Connecting Claude to HubSpot and GA4 takes ten minutes. Getting accurate revenue answers takes context engineering, the layer that tells the agent what your data actually means.