Funnel Analytics for B2B SaaS Founders Tired of Dashboards That Don't Agree
TL;DR: Funnel analytics in B2B SaaS is the practice of measuring how prospects move from first touch to paying customer across every system in the stack, not inside one tool. The recurring problem isn't that dashboards are wrong. It's that the patterns moving revenue live in the space between them: between marketing's view and sales' view, between what each tool tracks and what no one thought to chart. AI can handle much of that pattern-finding repeatedly or on demand. Humans still own the judgment.
Your web analytics show you traffic. Your CRM shows you deals. Neither shows you the connection between the two, and that connection is where your revenue decisions live.
Why funnel analytics dashboards weren't enough
Funnel analytics built on individual dashboards can miss the most expensive question of all: how channels actually translate into revenue across systems.
Until we put AI on top of our analytics, I didn't realize how expensive our reports actually were.
Every month before our analytics review, the same routine: open GA4, then HubSpot, then Google Ads, LinkedIn, Semrush, Search Console. Then the Google Sheet with fourteen tabs where all of it was supposed to come together. Then a few days copying numbers, refreshing pivots, and building the same slides for the same monthly meeting.
That part was costly. But not the most expensive part.
The most expensive part was looking at one chart at a time.
A paid channel might show a high cost per conversion in the campaign report, and the natural reaction is to question whether to keep funding it. But the same channel, looked at in another tool, might be producing the highest retention or the strongest lead-to-MQL rate that month. Each dashboard is accurate. Each dashboard is also incomplete. The channel that looks worst by one metric is sometimes the one that's actually working, visible only when the metrics are read together.
Those connections weren't on any dashboard. They lived between systems, and they only showed up when I went hunting: pulling extra reports, building one-off pivots, triangulating a hunch.
That hunting is where most of my real value came from. It's also where most of my time went.
The dashboards weren't the work. They were hygiene. The work was searching for signals between them.
That's the work AI handles well.
What is funnel analytics in B2B SaaS?
Funnel analytics in B2B SaaS is the measurement of how prospects move from anonymous visitor to closed-won deal across every system that touches them: web analytics, CRM, ad platforms, and product analytics, read together as one connected journey.
Most B2B SaaS companies have a similar stack:
- A web analytics tool (GA4 or similar) for traffic, sources, conversions
- A CRM (HubSpot, Salesforce, Pipedrive, others) for contacts, deals, pipeline
- One or more ad platforms for paid campaigns
- SEO tools for organic visibility
- Sometimes a product analytics tool for in-app behavior
Each one has its own dashboard, usually built by a different person for a different question. Each is accurate inside its own data, and incomplete on its own.
The interesting work starts when those tools are read together.
Why funnel and pipeline can't be looked at separately
A B2B SaaS funnel is one revenue system with two halves: the marketing funnel (visitor to MQL) and the sales pipeline (MQL to closed-won). When those halves are read separately, each tool gives an accurate but incomplete answer.
| What the tool shows you | What's missing |
|---|---|
| Web analytics: Traffic, sources, form fills | Whether those form fills ever became revenue |
| CRM: Deals, pipeline, win rates | Where those deals actually came from |
| Ad platforms: Clicks, CPL, CTR | Whether those clicks turned into closed-won, or stalled at MQL |
The questions that actually move budget decisions live across the two halves:
- Which sources produce leads that move through pipeline, and which produce volume that stalls?
- Where is the funnel leaking, and between which two systems?
- What changed this month that wasn't visible in any single dashboard?
Three patterns that appear regularly when the two halves get read together, and almost never when they don't:
Marketing scaling the channel that brings small deals
Marketing reports look at lead volume by source. One channel sends ten times more leads than another, so the budget shifts to the channel with the volume.
Two halves later, in the CRM, those leads turn into deals of very different sizes. The high-volume channel might bring in deals around $5K. The "low-volume" channel might bring in deals around $50K. Five times fewer leads, ten times the deal size. The pipeline contribution flips entirely.
Marketing isn't seeing this in its own dashboard. The hand-off from web analytics passes source, medium, and campaign. It doesn't pass deal size. The team scales the channel that looks productive in the marketing view, while the channel that actually drives revenue stays underfunded.
"Direct traffic" that isn't direct
In many B2B SaaS companies, a meaningful share of inbound traffic shows up as Direct in the web analytics tool. In B2B SaaS, that bucket is rarely actually direct. It's dark social: a LinkedIn post someone read on Monday, a Slack community recommendation on Tuesday, a podcast mention on Wednesday. The user typed the URL on Friday because they remembered the brand.
The CRM shows the same person as a Demo Form fill from Direct. The team defunds LinkedIn because "we can't see the ROI." The channel that built the preference disappears from both dashboards.
Time-to-close that changes channel economics
Two channels look identical on cost per lead. Same CPL, similar volume. Looked at on their own, they're equivalent.
In the CRM, one closes deals in 45 days and the other in 130. Same CAC, very different cash flow and payback. Sales capacity ties up four times longer on the slow channel. None of that shows up in the marketing dashboard, because time-to-close lives in the CRM.
When patterns like these stay invisible, the wrong channel gets scaled, the right channel gets defunded, and the team has the same argument every quarter because nobody can prove anyone wrong.
The five-question diagnostic in our B2B SaaS Funnel Self-Check is one place to start mapping where the leaks are. For why headline conversion rates can look healthy while revenue stalls, the dynamics are covered in B2B SaaS Funnel Conversion Benchmarks.
What AI on joined funnel data actually finds
AI on joined funnel data finds patterns no individual dashboard was built to surface: cross-system correlations, anomalies in real time, segments converting differently from the average, and tracking-health shifts that wouldn't be noticed until the quarterly review.
Dashboards do their job. They answer the questions that were known when they were built.
But static reports show a frozen picture of those questions. Real investigation starts when something prompts a new question (a hypothesis, a hunch, an anomaly worth checking), and that's where existing dashboards stop being enough.
That's the work AI handles continuously, on the connected surface of a revenue system.
What that looks like in practice (an example exchange):
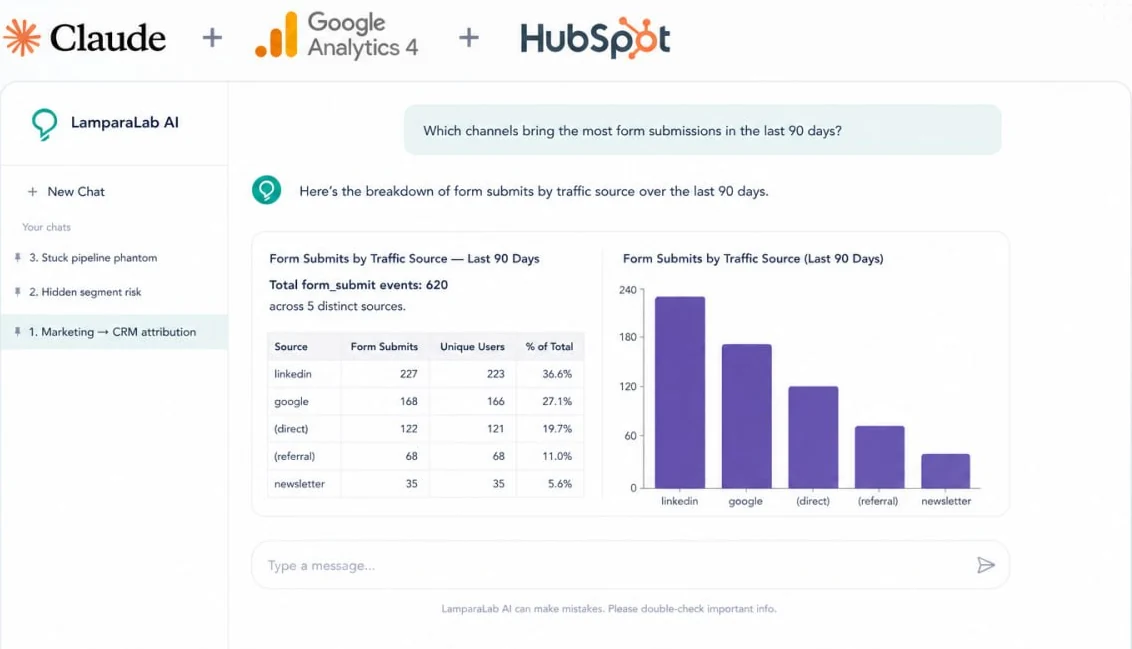
Q: "Why did our /demo page conversion rate drop?"
A: "The page conversion rate is stable. Form submissions are at the normal weekly volume. But the share of leads tagged as 'Direct Traffic' in the CRM jumped from around 22% to around 40% starting on March 14th, which is when the share of paid-source attribution dropped by a similar amount. Worth checking what changed on or near that date in how form data is passed to the CRM."
That's not a dashboard. That's the kind of question a senior analyst would ask if they were continuously reading both systems at once.
Where AI on funnel data helps, and where it doesn't
AI on funnel data is genuinely strong on patterns and arithmetic across connected systems, and honestly limited on conversation-level signals and anything outside the data. Worth being specific about both.
Where it helps
- Funnel math across systems. The arithmetic that's too tedious to maintain in spreadsheets: sign-up-to-appointment rate by source, sign-up-to-deal velocity by segment, conversion deltas between two stages that live in different tools.
- Cross-system patterns over time. How traffic behaviour in one tool tracks against pipeline movement in another. For example, watching how a change in paid traffic correlates with the rate of new deals appearing in the CRM, week over week.
- Anomalies in real time. Sudden shifts a static dashboard would surface only at the end of the quarter. A 45% drop in paid sessions over two days. A spike in form fills from a source that hadn't sent any traffic the week before.
- Metrics outside the expected range, with a path to investigate. AI notices when a number sits well outside the usual range, for example, a 15% win rate when your relevant benchmark is closer to 20 to 30%, and immediately offers the next slice to look at: by segment, by source, by sales owner. Static dashboards show the number. AI shows the number and the next question.
Where it doesn't
- Conversation-level signals. What a buyer was waiting on internally, what objections came up on discovery, which competitor closed them. That lives in sales calls, not in any system AI reads by default. The fix: feed call transcripts and demo recordings into the same analysis. Once that data is in the loop, funnel patterns and conversation patterns can be compared.
- Dark funnel. Peer recommendations, Slack DMs, podcast mentions. Touchpoints that never enter the data. The fix: add a "How did you hear about us?" field on sign-up. Imperfect, but it's the only signal you'll get from the dark funnel.
- CRM hygiene gaps. AI can only analyze what's recorded, and what's recorded depends on tracking setup and CRM configuration. If closed_lost_reason is empty on every deal, AI can tell you that deals were lost, not why. The fix: before any analytics layer, fix five fields: deal stage, closed-lost reason, lifecycle stage, lead source, deal type. Even a short cleanup can materially increase the value of every analysis afterward.
- Small data volumes. With only a few deals per month, single-month patterns are easy to over-trust. The fix: look for trends that hold across several months, not for one-off moves.
The honest framing: AI is strong on the data layer of a revenue system (patterns, anomalies, cross-system math). It doesn't replace the sales conversations or the analyst judgment that interpret what those patterns mean.
Can AI answer this? An honest summary
| Question | Can AI on funnel data answer it? |
|---|---|
| Where is the funnel leaking? | ✅ Yes, its strongest use case |
| Which channel is the strongest pipeline pattern? | ⚠️ Directionally, via correlation, not user-level attribution |
| What changed in the funnel this month, and why? | ✅ Yes, anomalies and tracking-health shifts surface fast |
| Why are deals stalling at a specific stage? | ⚠️ Partially. It shows where and which segments, not why |
| What did the buyer's full journey look like? | ❌ No. Too many touchpoints are outside the systems |
| Why did a specific deal die? | ⚠️ Partially. CRM data shows when and where it stalled. The "why" lives in calls and emails, and becomes available to AI once that data is connected |
The value isn't omniscience. It's speed and pattern detection on the data already collected, which, for most teams, is sitting in several systems no one has the time to read together.
Three things that change when funnel analytics works across systems
When funnel analytics is read across systems instead of inside each tool, three concrete shifts show up in how a founder or CMO operates.
Budget decisions become less political. The CMO defends a channel based on one tool. The CFO challenges it based on another. With one joined view and one prompt, both people see the same answer in 30 seconds.
Patterns surface before they become problems. Channels that are quietly working get caught before they're cut. Channels that look strong but aren't producing revenue get caught before they're scaled.
Reporting becomes a conversation, not a monitor. Old flow: open dashboard, see number, don't know what to do. New flow: ask question, get an answer with two or three hypotheses, test them with the next prompt.
That's the difference between marketing as a cost center and marketing as a revenue engine.
Common questions
What is funnel analytics in B2B SaaS?
Funnel analytics in B2B SaaS is the measurement of how prospects move from first touch to closed deal across every system in the stack: typically web analytics for site behavior, a CRM for pipeline, and ad platforms for paid sources. The point is to read the journey as one connected system, not as separate dashboards.
How is funnel analytics different from web analytics?
Web analytics measures what happens on a website: traffic, page views, conversions, form fills. Funnel analytics extends past the website into the CRM and revenue side, joining visitor data to actual deal outcomes. Web analytics tells you a form was filled. Funnel analytics tells you whether that form fill ever became revenue.
What is an example of funnel analysis in B2B SaaS?
A typical B2B SaaS funnel analysis tracks the journey from web session to closed-won deal: sessions, engaged sessions, form submissions, CRM contacts, MQLs, SQLs, deals, closed-won. The analysis identifies which stage has the largest relative drop, whether the drop is consistent across cohorts, and which channels or segments behave differently. A worked example in five questions is in our B2B SaaS Funnel Self-Check.
How does funnel analytics work in Google Analytics 4?
Google Analytics 4 includes a Funnel Exploration report that lets you define a sequence of events (for example: page view, sign-up, demo request, purchase) and see how users move through it. GA4 funnels can be open (users can enter at any step) or closed (users must enter at step one). The limitation: GA4 only sees the website portion of the funnel. Anything that happens after a contact enters the CRM (pipeline progression, deal velocity, closed-won) lives outside it. For full B2B SaaS funnel visibility, GA4 has to be read alongside the CRM.
What's the difference between a dashboard and AI-driven funnel analytics?
A dashboard answers a question someone knew to ask in advance. It's static by design, and that's fine. AI-driven funnel analytics works on top of what dashboards do, surfacing patterns no one charted: cross-system correlations, anomalies, segment shifts. Dashboards are hygiene. Pattern-finding is the work.
What can't AI funnel analytics see?
AI reads the data inside connected systems. It can't see what isn't there. That includes conversation-level signals from sales calls, dark-funnel touchpoints (peer recommendations, Slack DMs, podcast mentions), and anything that didn't enter the tools in the first place. It also won't produce reliable patterns if pipeline stages or source fields are used inconsistently. AI handles the data layer well; the conversation layer still belongs to humans.
Where should we start before adding AI?
Make sure what existing tools do capture, they capture consistently. UTMs surviving redirects. Form data flowing into the CRM. Lifecycle stages and source fields used the same way across the team. The five-question audit in B2B SaaS Funnel Self-Check covers the most common gaps. This is also where reading the situation usually starts: finding what's silently broken before any dashboard is read.
Read next
What Revenue Analysis Misses About B2B SaaS Growth
Revenue analysis shows where deals stall, but rarely why. In B2B SaaS the real leak is timing — reaching good-fit accounts at the wrong moment. Here's the fix.
Ideal Customer Profile Framework for B2B SaaS: The ICP-to-Revenue Journey
An ideal customer profile framework for B2B SaaS that reverses customer journey analysis — start from Closed Won deals, derive your ICP from real revenue, then connect HubSpot and GA4 backward to find the patterns that produce revenue.