A B2B SaaS Funnel Self-Check in Five Questions
Most funnel diagnostics start with numbers. Conversion rates, pipeline coverage, win rate by stage. The assumption is that if the numbers look off, the problem is visible.
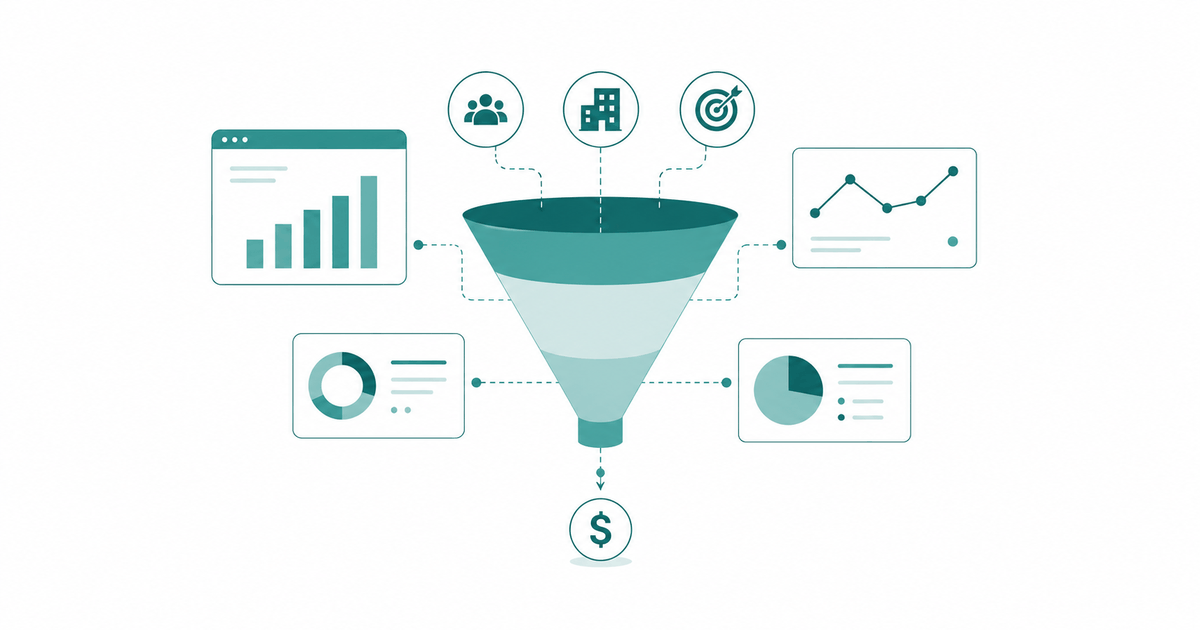
But when the numbers look fine and revenue still isn't growing, a static dashboard stops being useful. The signal lives between systems: in how web analytics data lines up (or doesn't) with the CRM, in which channels survive the handoff, in which questions a single tool can't answer on its own.
This one starts with five questions instead. Each one points to a specific kind of leak.
The questions below follow a diagnostic funnel, from broad (is there enough traffic, and does it convert?) to narrow (which pages do people actually read before filling out a form?). Each one sharpens the hypothesis set by the previous.
Two tabs open, web analytics and CRM, and fifteen minutes.
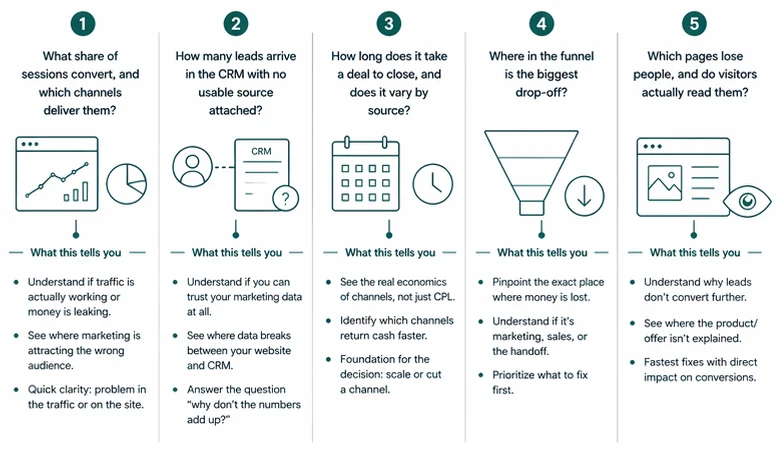
What share of sessions convert, and which channels deliver them?
Start at the top of the funnel. Is there enough traffic, and does any of it turn into form submissions?
Any web analytics tool (GA4, Mixpanel, Matomo, Plausible) answers this directly. Group sessions by source/medium over the last 90 days, and look at two numbers per channel: the count of key events (form submissions, demo requests, thank-you page visits, whichever event marks a lead submission on the site), and the conversion rate, meaning the share of sessions from that channel that ended with the event.
The report will look something like this:
| Session source / medium | Sessions | Key events | Session key event rate |
|---|---|---|---|
| google / organic | 1,650 | 48 | 2.9% |
| (direct) / (none) | 1,420 | 28 | 2.0% |
| newsletter / email | 220 | 9 | 4.1% |
| google / cpc | 980 | 4 | 0.4% |
| linkedin / paid | 540 | 1 | 0.2% |
Illustrative data, not from a specific account.
What the numbers suggest
| Pattern | Likely explanation |
|---|---|
| Conversion rate below 0.5% on a warm channel (branded, direct, email) | The site or offer is the bottleneck. Even engaged visitors aren't converting |
| Branded or direct converts well, paid converts near zero | Paid is likely attracting the wrong audience, or landing pages don't match ad intent |
| One channel carries more than 70% of traffic | Concentration risk. If that channel moves, so does the funnel |
| A channel with meaningful traffic and zero key events | Either a real gap in the funnel, or a tracking issue worth checking first |
This question is the starting point because everything downstream depends on it. If key events aren't configured in the analytics tool, or the form submission event isn't firing, the diagnostic stops here until the top of the funnel is actually being measured.
How many leads arrive in the CRM with no usable source attached?
UTM parameters are often lost in the handoff between the website and the CRM. They carry source, medium, and campaign data, but this layer breaks when forms, embeds, redirects, or tracking scripts fail to pass values through. As a result, contacts appear as direct, offline, or with no source value at all.
Most CRMs (including HubSpot, Salesforce, Pipedrive, and Attio) store source fields on the contact record. Pull the last 90 days of new contacts, group by original source, and review how many records have a usable value.
| Original source | Contacts | % of total |
|---|---|---|
| Organic search | 62 | 28% |
| Direct traffic | 58 | 27% |
| Paid search | 18 | 8% |
| Email marketing | 15 | 7% |
| Offline sources | 41 | 19% |
| Source unknown (blank) | 24 | 11% |
Illustrative data, not from a specific account.
In this example, a large share of contacts (direct, offline, or blank) does not carry reliable marketing attribution.
Two checks before drawing conclusions:
First, "offline sources" does not only mean events or offline marketing. In tools like HubSpot, it often includes contacts created via API, imports, or manual entry by sales. This is operational data, not a marketing signal.
Second, original source is based on software attribution (typically cookies). It degrades over time. In longer sales cycles, a contact may return as direct even if the original touchpoint was paid or organic.
What the numbers suggest
| Pattern | Likely explanation |
|---|---|
| More than 40% of contacts fall into direct, offline, or unknown | Attribution is incomplete. Data is not consistently passed into the CRM |
| Paid channels barely appear as a source | The form isn't capturing UTMs, or the CRM integration isn't passing them to the contact record |
| Large "offline" bucket in an inbound motion | Likely driven by imports, integrations, or manual creation. Check how contacts enter the CRM |
This creates a blind spot that affects every downstream metric.
How long does it take a deal to close, and does it vary by source?
Sales cycle length is one of the clearest signals of unit economics by channel. Two channels can produce the same number of deals at the same win rate, and one can still be meaningfully more profitable because it closes faster. Cash returns sooner, payback shortens, sales capacity goes further.
In the CRM, run a closed-won deals report for the last six months, group by the contact's original source, and show days to close per channel.
| Original source | Closed-won deals | Median days to close |
|---|---|---|
| Referral | 8 | 52 |
| Email marketing | 11 | 68 |
| Organic search | 19 | 89 |
| Paid search | 14 | 124 |
| Outbound | 9 | 148 |
Illustrative data, not from a specific account.
In this example, referral and email close in roughly two to three months. Paid search and outbound take closer to four to five. Even with similar cost per lead and win rate, the faster channels return cash quicker and tie up less sales capacity.
Three caveats before drawing conclusions. First, the default "days to close" counts from deal creation, not contact creation, so it misses the nurture period that in B2B can run for months. Second, deals with multiple associated contacts inherit original source from the primary contact, which may not reflect the full buying committee. Third, as with Question 2, deals need to be linked to contacts with usable source values for this view to hold.
What the numbers suggest
| Pattern | Likely explanation |
|---|---|
| All channels close within a similar range | Sales cycle is shaped by the product or buying process, not the channel. Look elsewhere for economics levers |
| One channel closes in half the time of others | Stronger intent or better fit. Usually worth prioritising before scaling colder channels |
| Paid channels take more than twice as long as organic | Paid is likely attracting earlier-stage buyers, or nurturing is missing between first touch and sales conversation |
| No usable data because deals aren't linked to contacts or sources are blank | Channel economics can't be measured. Fix the CRM linking before making budget decisions |
Cost per lead is the number most teams optimise. A truer view of channel economics combines CPL, win rate, and cycle length. This calculation is rarely built into standard dashboards but easy to run from existing CRM data.
Where in the funnel is the biggest drop-off?
The previous questions looked at channels and economics. This one looks at the shape of the funnel itself. Every B2B SaaS funnel loses people at each stage, and the waterfall is the only view that shows which stage is leaking, how badly, and whether that's changing over time.
Build the waterfall from both tools. Web analytics gives the top (sessions, engaged sessions, form submissions). The CRM gives everything below (new contacts, MQLs, SQLs, deals created, deals closed). For shorter sales cycles, 90 days works. For cycles of 6 months or more, use 6 to 12 months so the bottom of the funnel has time to fill in.
| Stage | Count | Conversion to next stage |
|---|---|---|
| Sessions | 12,000 | 35% engaged |
| Engaged sessions | 4,200 | 4.5% form submit |
| Form submissions | 190 | 63% become contacts with usable data |
| Contacts (usable) | 120 | 42% MQL |
| MQLs | 50 | 46% SQL |
| SQLs | 23 | 52% deal created |
| Deals | 12 | 42% closed-won |
| Closed-won | 5 | — |
Illustrative data, not from a specific account.
Reading the waterfall: the largest relative drop points to a stage worth investigating, but it's rarely the full answer. The same stage can look different across cohorts (leads from March versus leads from September) or across channels blended into the total. Before acting on a single drop, check whether it's consistent over time or concentrated in recent months. A stable drop is a structural issue. A recent drop usually means something changed.
Two things the waterfall depends on. First, data alignment between systems: form submission events and new contacts rarely match exactly, because of bots, duplicates, and contacts created through other paths. A 10–20% variance is normal. More than that usually points back to Question 2. Second, consistent definitions of MQL and SQL. If the team can't agree on what each stage means, the numbers can't be read cleanly. This is often the hidden reason the waterfall looks odd.
What the numbers suggest
| Pattern | Likely explanation |
|---|---|
| Biggest drop between sessions and form submissions | The site isn't converting engaged traffic. Messaging, form friction, or offer clarity |
| Biggest drop between contacts and MQLs | Lead quality is low, MQL scoring is too strict, or ICP and traffic are mismatched |
| Biggest drop between MQLs and SQLs | Handoff issues: speed-to-lead, unclear SLAs, weak intent, or scoring that doesn't match sales criteria |
| Biggest drop between SQLs and closed-won | Sales execution, not marketing. Discovery, demo quality, or pricing objections |
Different stages of the funnel are typically owned by different people or teams. The waterfall is the only view that makes those ownership boundaries visible at once, and makes it clearer which team actually needs to change something. For cases where each stage looks healthy on its own but revenue still isn't following, the patterns that hide inside the blend are covered separately in B2B SaaS Funnel Conversion Benchmarks.
Which pages lose people, and do visitors actually read them?
This question moves from channels and funnels down to individual pages. Two signals matter together: exit rate (how often a session ends on the page) and average engagement time (how long people spend reading it).
Any web analytics tool (GA4, Mixpanel, Matomo) has a pages report that shows views, exit rate, and engagement time per page. That's all that's needed here.
Exit rate alone isn't a problem signal. Blog posts naturally have high exit rates because people read and leave. What matters is the combination on decision-stage pages (pricing, product, demo, case studies): a high exit rate with short engagement time usually means the page isn't doing its job.
The report will look something like this:
| Page | Views | Exit rate | Avg engagement time |
|---|---|---|---|
| / (homepage) | 92 | 53% | 42 sec |
| /pricing | 64 | 66% | 18 sec |
| /product/features | 48 | 46% | 1 min 12 sec |
| /blog/[any post] | 40 | 60% | 2 min 30 sec |
| /case-studies | 18 | 44% | 1 min 5 sec |
| /demo | 24 | 33% | 22 sec |
Illustrative data, not from a specific account.
In this example, the pricing page is the clearest signal. High exit rate (66%), very short engagement time (18 seconds). People arrive, look, and leave without reading. Most often this is a price mismatch, an unclear offer, or missing context (social proof, ROI, what the price includes).
The blog page has a similar exit rate but a very different engagement time. Two and a half minutes suggests people are actually reading before leaving. That's a different problem (or no problem at all) than the pricing page.
What the numbers suggest
| Pattern | Likely explanation |
|---|---|
| High exit rate and short engagement time on pricing or product pages | The page isn't delivering what visitors came for. Messaging, pricing presentation, or missing context |
| High exit rate and long engagement time on blog pages | Normal behaviour for informational content. People read and leave |
| High exit rate with very short engagement across the homepage | First impression isn't working. Messaging not matching expectations, or hero section not clear about what the product does |
| Product or landing pages near 100% exit rate | Dead-end pages. No internal links, no CTA, or CTA not compelling enough to continue |
These fixes tend to be the fastest to test, because they don't require coordinating across systems.
When the questions raise more questions than answers
The five questions above usually surface two or three places where something doesn't look right. The harder part is deciding which one actually matters and in what order to fix them.
That's the part that doesn't fit into fifteen minutes on your own. It takes connecting your data into one focused review across marketing analytics, CRM, and support data — to see which leaks are real, which are artefacts of the tooling, and which one to fix first.
Common questions
Why aren't my B2B SaaS leads converting to customers?
Most B2B SaaS funnels lose leads in the middle, not at the top. The usual causes are slow follow-up, broken attribution that mixes unrelated contacts into a single "direct" bucket, and mismatched MQL definitions between marketing and sales. Running through the five questions above usually reveals which one is the actual bottleneck.
What is a good conversion rate for a B2B SaaS website?
The commonly cited range for visitor-to-lead conversion is 1 to 3 percent. Warm traffic (branded search, direct, email) usually runs higher, closer to 2 to 4 percent. Cold traffic (paid, display) tends to be 0.5 to 2 percent. Numbers well below these ranges usually point to the site or offer, not the traffic.
How do I find revenue leaks in my B2B SaaS funnel?
Start by checking that data across web analytics and CRM aligns at each stage. Then compare the same stage transitions across cohorts, month by month or quarter by quarter. Leaks usually surface as a drop that appears in recent data but wasn't there before, rather than as a single "bad" stage. If more than 40 percent of CRM contacts arrive as "direct" or "offline", the source data is unreliable before any leak analysis can run.
Why are my paid leads not converting as well as organic leads?
Paid channels reach buyers earlier in their decision process than organic search or referral. This usually results in lower win rate and longer sales cycles, even when cost per lead looks comparable. Before cutting paid budget, check whether landing pages match ad intent and whether paid contacts arrive with usable attribution.
Read next
What Revenue Analysis Misses About B2B SaaS Growth
Revenue analysis shows where deals stall, but rarely why. In B2B SaaS the real leak is timing — reaching good-fit accounts at the wrong moment. Here's the fix.
Ideal Customer Profile Framework for B2B SaaS: The ICP-to-Revenue Journey
An ideal customer profile framework for B2B SaaS that reverses customer journey analysis — start from Closed Won deals, derive your ICP from real revenue, then connect HubSpot and GA4 backward to find the patterns that produce revenue.