How Can the HEART Framework Help to Understand and Measure the Product's Success?
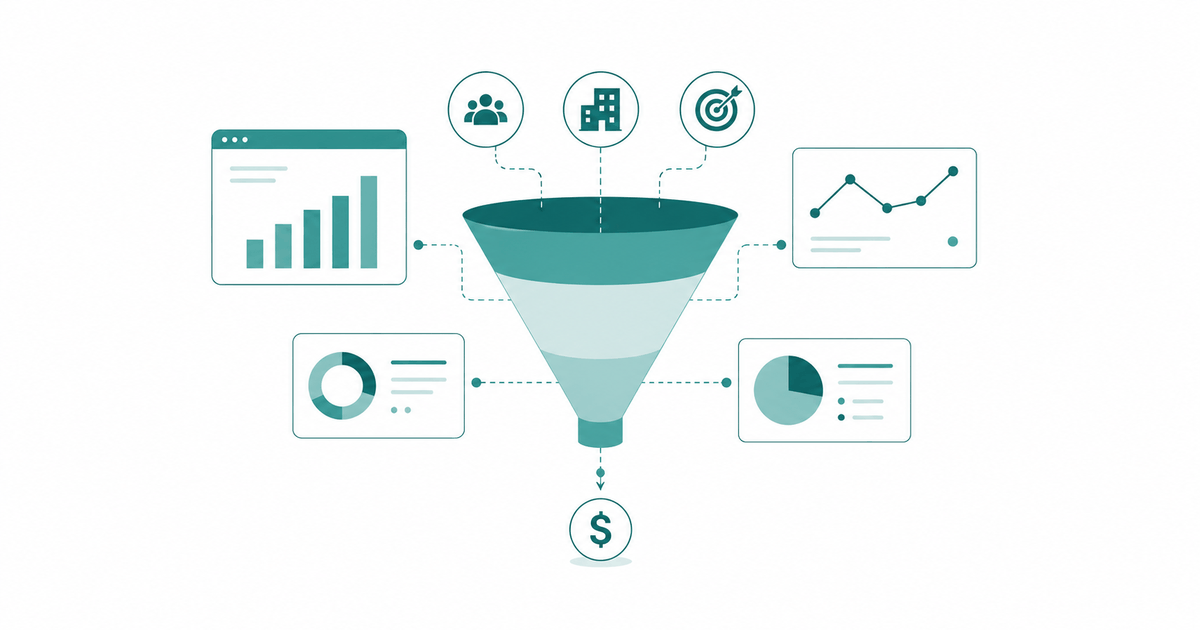
I'd like to tell you about a framework called HEART, which was made by Google. I've used it on one project. This framework helps to choose the necessary metrics for the product and measure the quality of user experience. It's a handy framework that helps you to understand and measure product success. If you've never used it, I strongly recommend you try it. It's very easy. I'll show you.
Where It Started
Some time ago I worked for a startup. We were creating a mobile app and had to answer some questions:
Do the users understand how to use this app? Could the app help them to solve their problems? Are they happy with the results? Will they return next time or will they stop using it?
I looked for an easy framework that could help to choose the right metrics, group metrics with similar parameters and give more ideas on how to measure the quality of user experience. I found the HEART framework and made my matrix. Here's how it works.
What Does the HEART Framework Stand For?
All of the letters stand for five categories: Happiness, Engagement, Adoption, Retention and Task Success.
| Category | What it measures | |
|---|---|---|
| H | Happiness | Attitude to the product. Are the users satisfied and would they like to recommend it? Is this product easy to use? |
| E | Engagement | Level of interest and involvement. How many visits per user per week? How many photos uploaded per user per day? |
| A | Adoption | How many users start to use a product for the first time. Has using the product become a habit? How many people become regular users? |
| R | Retention | How many users from a given time period have come back in a later period. What percentage of returning users are using this product? |
| T | Task Success | Success of completing main tasks with the help of your product. What percentage of users have been able to solve their problems? What's the error rate? |
Goals, Signals and Metrics of the HEART Framework
For each of the five categories, you define three things:
-
1
Goals
Help us to identify the purpose of the product or feature, especially in terms of user experience.
-
2
Signals
Help us to understand if users are achieving their goals or failing. Here you should pay attention to the feelings and actions of your customers.
-
3
Metrics
Help you to transform signals into value. They should measure the signals and indicate success or failure.
The goal is to fill out the table with the necessary data for each category. Then discuss it with the team before drawing any conclusions.
The Full HEART Matrix
| Category | Goal | Signals | Metrics |
|---|---|---|---|
| Happiness | Increase the number of people who feel satisfaction after using your product. Ideally, create a wow effect for your customers. | Users send you positive feedback, leaving a 5-star rating; they recommend the product to their friends. | App Rating, NPS, CSAT, CES |
| Engagement | Increase the time that users spend in a day using your product. | People spend more time using the product, they open your emails, write comments on social media. | Session Duration, Session Frequency, Depth of Usage, Active Users, Open Rate, Social Activity |
| Adoption | Increase the number of people who will install updates. | Users register an account, and they start to use pay functions. | New Users, Activation Rate, Conversion Rate, Purchase Rate, Avg Order Value |
| Retention | Increase the number of people who making repeat purchases. | Users making repeat purchases, use some features many times. | Retention Rate (CRR), CLV, Avg Revenue per Customer, Churn Rate, Repeat Purchase Rate |
| Task Success | Increase the number of people who should be able to solve their problems with the help of the product. | User complete tasks or have mistakes and leave the tasks unfinished; they buy successfully or abandon the cart. | Task Success Rate, Time on Task, Error Rate, Failure Rate, ANR |
You don't have to use all of the categories. Choose the ones that fit your project. For example, if you start A/B tests and want to know which version is more effective and causes fewer errors, you can choose only Task Success and fill out Goals, Signals and Metrics for it.
What Is the Next Step?
When the table is ready, discuss it with the team. Sometimes members have different thoughts about the categories, goals and signals, and it's really very important to come to a common vision.
We used this framework for the startup. I created the table, we discussed it with the team, got data, analyzed it and made some improvements to our product. This method worked for our team.
How HEART Framework Signals Connect to Revenue
HEART measures user experience, but each category has a direct link to business results. Retention has the most direct impact: users who stay generate recurring revenue. Low Task Success leads to churn. Low Adoption means your acquisition spend isn't converting. When you track HEART signals over time and connect them to your pipeline data, patterns emerge that show exactly where UX problems are costing you revenue.
| Goal | Signals | Metrics | Revenue Impact | |
|---|---|---|---|---|
| H Happiness |
Increase satisfaction after using product. Create a wow effect for customers. | 5-star ratings; positive feedback; users recommend product to friends. | App Rating · NPS · CSAT · CES | Higher NPS improves conversion and referrals; supports upsell. |
| E Engagement |
Increase daily time users spend with the product. | Longer sessions; email opens; social comments; repeat feature use. | Session Duration · Active Users · Open Rate | Core feature engagement improves conversion and retention → LTV. |
| A Adoption |
Increase new users who install updates and use paid features. | New registrations; users activate paid functions. | New Users · Activation Rate · Conversion Rate | Activation and conversion to paid plans drive MRR growth. |
| R Retention |
Increase repeat purchases and returning users. | Repeat purchases; features used multiple times. | Retention Rate · CLV · Churn Rate · Repeat Purchase | Primary driver of ARR and CLV. Small churn reductions significantly increase revenue. |
| T Task Success |
More users solving problems with the product. | Tasks completed or abandoned; purchases vs cart abandonment. | Task Success Rate · Error Rate · Time on Task | Higher task success drives conversion; fewer errors cut support costs. |
How Long Does It Actually Take to Build the HEART Framework Matrix?
When I was doing this at the startup, it took days. Pulling data from different tools, aligning the team on which signals actually matter, going back to check the numbers.
All the signals are already there: in your GA4, your CRM, your support tickets. The hard part is getting them out fast enough to act on.
That's what I do at LamparaLab. I connect to your analytics with read-only access and pull the signals that map directly to this matrix: where users drop, what they don't complete, where engagement falls off. What used to take days now takes a fraction of the time. And instead of just a filled-out table, you get a clear answer: what to fix first, and how it connects to revenue.
Common questions
What is the HEART framework?
The HEART framework is a method for measuring user experience, developed by Google's UX research team. The acronym stands for Happiness, Engagement, Adoption, Retention, and Task Success. It helps product teams choose the right metrics and connect UX quality to business outcomes.
Who Created the HEART Framework by Google?
The HEART framework was created by Kerry Rodden, Hilary Hutchinson, and Xin Fu from Google's quantitative UX research team. It was first published in 2010 and remains one of the most widely used UX metrics frameworks today.
Is the HEART Framework Still Relevant?
Yes. The core questions HEART asks haven't changed: are users happy, are they coming back, can they complete their tasks. What has changed is that it's now much easier to collect and analyze these signals automatically through tools like GA4, Mixpanel, or your CRM. The framework is still widely used by product and UX teams around the world.
Do I need to use all five HEART categories?
No. You choose only the categories that are relevant to your current goal. If you're running an A/B test to reduce error rates, Task Success alone is enough. If you're launching a new feature, Adoption and Engagement might be your focus. The framework is flexible by design.
What is the difference between Adoption and Retention in HEART?
Adoption measures new users: how many people start using your product or a feature for the first time. Retention measures returning users: how many people who used the product before come back. Tracking both together shows whether your user base is growing or just churning through new people.
What is the Goals-Signals-Metrics process in HEART?
Goals-Signals-Metrics (GSM) is the process that makes HEART actionable. Goals define what you want to achieve in terms of user experience. Signals are the observable user behaviors that tell you whether you're moving toward or away from that goal. Metrics are the specific numbers you track to measure those signals over time. You always start with the goal, not the metric.
How does the HEART framework connect to revenue?
Each HEART category has a direct link to business results. Retention drives ARR and CLV. Low Task Success leads to churn. Low Adoption means your acquisition spend isn't converting. When you track HEART signals over time and connect them to your pipeline data, patterns emerge that show exactly where UX problems are costing you revenue.
Read next
What Revenue Analysis Misses About B2B SaaS Growth
Revenue analysis shows where deals stall, but rarely why. In B2B SaaS the real leak is timing — reaching good-fit accounts at the wrong moment. Here's the fix.
Ideal Customer Profile Framework for B2B SaaS: The ICP-to-Revenue Journey
An ideal customer profile framework for B2B SaaS that reverses customer journey analysis — start from Closed Won deals, derive your ICP from real revenue, then connect HubSpot and GA4 backward to find the patterns that produce revenue.