B2B SaaS Sales Funnel: Why Leads Aren't Turning Into Revenue
When I ask B2B SaaS founders where growth breaks down, acquisition or later in the funnel, the answer is almost always the same: acquisition. We need more leads.
It's a reasonable instinct. Acquisition is visible. The numbers move, the dashboards update, there's always something to optimize. But when I pull the data, marketing analytics, CRM, and support data, the picture is usually more complicated. Most of the time the funnel already has enough coming in. What's broken is somewhere in the middle or the end: conversion, onboarding, retention. This piece is about what I actually look at when I'm trying to figure out where the revenue is going.
Why B2B SaaS Growth Stalls When You Focus Only on Leads
It makes sense that acquisition feels like the lever. Traffic, CPL, lead volume, these numbers are visible, move quickly, and are easy to discuss. Mid-funnel conversion rates and 90-day churn are harder to pull and less intuitive to read.
When I look at the data, acquisition turns out to be the root cause of a revenue problem roughly 20% of the time. The other 80% sits somewhere in qualification, the sales process, onboarding, or retention, layers that are harder to see without the right reports in place.
- What % of leads actually become customers, and where does the rest drop out?
- What's the #1 reason deals are lost (closed lost in your CRM)?
- What's the 90-day churn rate?
- Which channel generates the highest win rate, not just the most leads?
If any of these are unknown, the funnel diagnostic comes before the acquisition investment.
Where Revenue Leaks Across the B2B SaaS Funnel
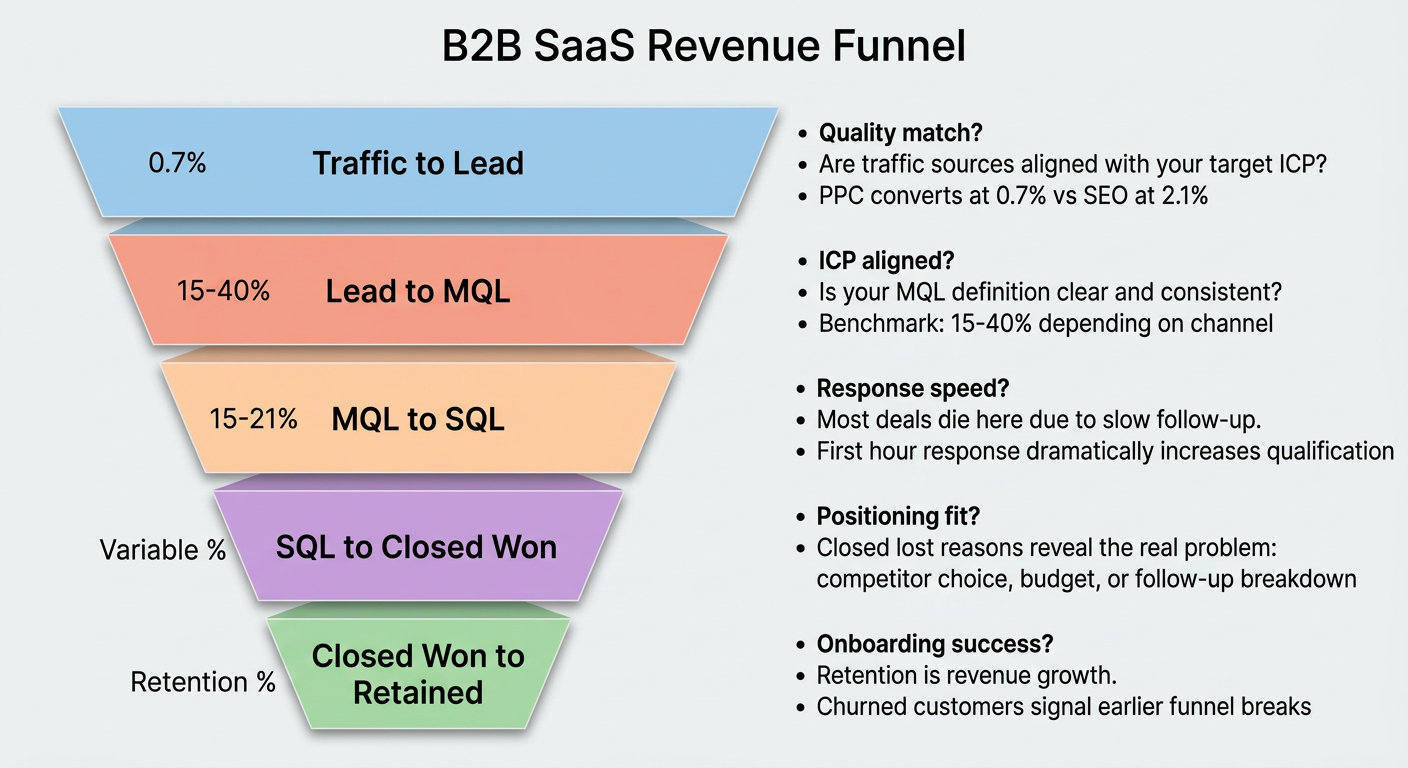
The B2B SaaS funnel has five distinct layers. The typical focus lands on the top (traffic) and the bottom (closed deals), everything in between tends to get less attention.
Layer 1: Traffic to Lead
This is where acquisition lives. The issue here isn't always volume, it's quality. High traffic with low engagement on pricing or demo pages usually signals a mismatch between who you're attracting and who your product is actually for. According to First Page Sage, PPC traffic converts to leads at just 0.7% visitor-to-lead, nearly 3x less than SEO-driven traffic at 2.1%.
Layer 2: Lead to MQL
A lead becomes an MQL when it matches your ideal customer profile. Industry benchmarks put lead-to-MQL conversion at 15–40% depending on channel and ICP definition. When this number is low, it often points to ICP definition or lead scoring rather than acquisition volume.
Layer 3: MQL to SQL
This is the marketing-to-sales handoff, and it's where B2B funnels most commonly break. 2025 benchmark data shows MQL-to-SQL conversion averaging 15–21% across the industry. The gap often isn't about lead quality, it's about speed. Research shows that responding within minutes can increase qualification rates by up to 21x, while the average B2B response time is still around 40–47 hours.
Layer 4: SQL to Closed Won
This is the sales process itself. When deals die here, the closed lost reasons tell you exactly where to look: "chose a competitor" → positioning or pricing problem; "no budget" → qualification or timing problem; "no response" → follow-up process is broken. None of these are solved by generating more leads.
Layer 5: Closed Won to Retained
Almost never discussed in the context of revenue growth, but often the most important layer. If you close 20 new customers a month and churn 15, you're not growing, you're running in place. Every churned customer is also a signal that something earlier in the funnel was broken: either you sold to the wrong person, or you failed to deliver on what was promised.
These layers are sequential. A leak in Layer 2 makes everything downstream worse. Fixing acquisition while Layers 2–5 are broken is not growth, it's an expensive way to stay flat.
How to Use B2B SaaS Analytics to See What's Breaking
Diagnosing a B2B SaaS funnel requires four data sources working together. Each one answers a different question.
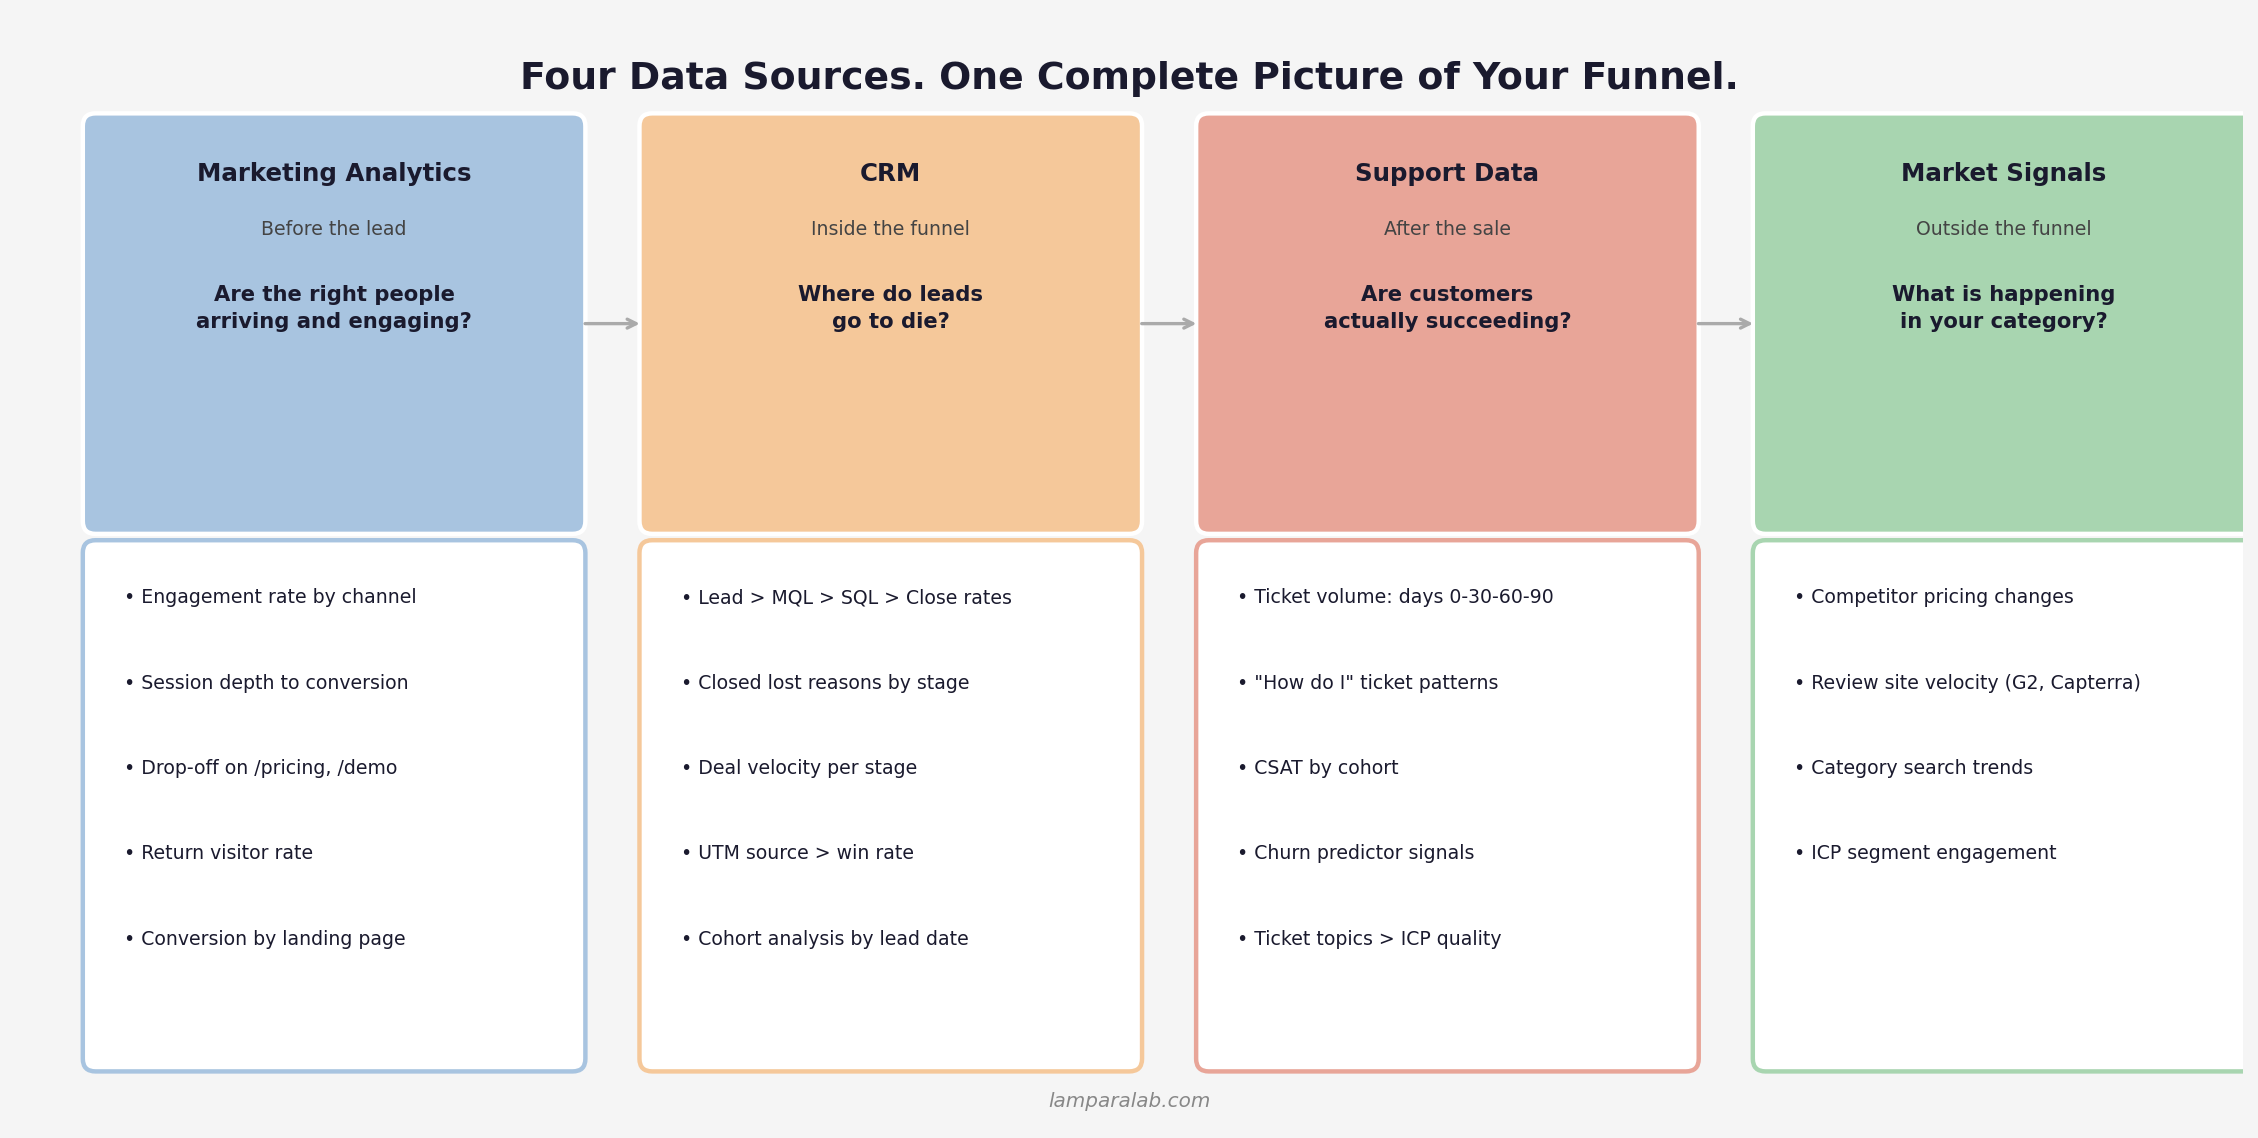
Marketing Analytics: Are the right people arriving and engaging?
| What to look at | What it tells you |
|---|---|
| Engagement rate by channel | A channel with 28% engagement is flooding your funnel with unqualified contacts |
| Behavior on pricing page | 80% bounce = problem with price presentation or CTA, not lead volume |
| Pages viewed before form submit | Which content actually moves people toward a decision |
| Return visitor rate | B2B buyers return 4–6 times before converting, low return rate = nurturing gap |
| Channel conversion rate | If organic converts at 3% and paid at 0.4%, scaling paid makes no sense |
CRM: Where do leads go to die?
| Funnel stage | Typical B2B SaaS range | If you're below: look at |
|---|---|---|
| Lead → MQL | 15–40% | ICP definition, channel quality, lead scoring |
| MQL → SQL | 15–21% | Speed to first contact, qualification criteria |
| SQL → Opportunity | 30–50% | First call quality, discovery process |
| Opportunity → Closed Won | 20–25% | Pricing, competitive positioning, objection handling |
The most important report in your CRM is closed lost reasons, broken down by stage. "No response" → follow-up broken. "Chose competitor" → positioning or pricing. "Not a fit" → wrong audience. None of these are acquisition problems.
Also look at deal velocity. Deals sitting in the same stage for more than two weeks without activity are effectively dead and create false confidence in your forecast.
Support Data: Are your customers actually succeeding?
| What to look at | What it signals |
|---|---|
| Ticket volume in first 30 days | High "how do I" volume = onboarding failing, churn risk high |
| Ticket categories by new vs. existing customers | Basic feature questions from paying customers → wrong ICP |
| CSAT scores by cohort | Low CSAT in month 1 predicts churn in months 3–4 |
| "This isn't what I expected" tickets | Marketing message doesn't match actual product |
| Closed-deal cohorts matched to support ticket patterns | Correlate month of deal close with churn rate, reveals which acquisition campaigns brought wrong-fit customers |
High ticket volume in the first 30 days often points to an onboarding gap, customers didn't get to value fast enough. That tends to show up as churn around the 90-day mark, and the instinct is to go fix acquisition. Usually it's worth looking at onboarding first.
Market & Competitor Signals: What's happening outside your funnel
| Signal to watch | What it tells you |
|---|---|
| Competitor pricing & positioning changes | If "chose competitor" is your #1 closed lost reason and a rival just dropped prices, that's a market problem, not a funnel problem |
| Category search trend (G2, Capterra, Google Trends) | Is demand for your category growing or contracting? Flat revenue in a shrinking category looks different than in a growing one |
| Review velocity on G2 / Capterra | Competitor gaining reviews fast = they're closing deals you're not. Cross-reference with your own closed lost reasons |
| LinkedIn & content engagement in your ICP segment | If organic impressions are up but form submissions aren't, there's an awareness-to-intent gap, not an awareness gap |
Market data is the context layer. If your funnel metrics look fine but revenue is still flat, the constraint may be category timing, competitor momentum, or ICP evolution, not anything in your marketing analytics or CRM dashboard.
How to Analyze a B2B Lead Funnel Without Perfect Attribution
A lot of B2B SaaS companies don't have User IDs configured in your analytics tool, and that's fine. It doesn't prevent a solid diagnosis. Without User ID, you shift from tracking individuals to tracking patterns, cohorts, and correlations.
UTM parameters are your most underused asset. When a visitor fills out a form, a CRM captures UTM source, medium, and campaign and stores them on the contact record. Build one report: UTM source → win rate → average deal size → days to close. That report alone will show you which channels generate revenue versus which generate noise. The gaps become obvious immediately.
Aggregate correlation fills the gaps. Even without individual tracking, you can correlate weekly lead volume by channel in your analytics tool with weekly MQL creation in your CRM, offset by your average sales cycle. If organic traffic spikes in week one and MQL volume follows in week three, organic is working. If paid traffic spikes but MQL doesn't follow, paid is bringing in the wrong audience.
Cohort analysis by lead creation date is the most powerful tool without full attribution. Group all leads created in a given month, track what % became MQL, SQL, and Closed Won over 90 days. When you find an underperforming cohort, investigate: was there a new campaign that month? A messaging change? This is how you find attribution insights without individual tracking.
A Simple Funnel Analysis Example: What to Fix First
Here's what a funnel diagnostic can look like for a B2B SaaS company generating 300 leads per month:
| Channel | Leads | MQL% | SQL% | Win% | Avg Deal | Revenue |
|---|---|---|---|---|---|---|
| Organic | 60 | 62% | 40% | 24% | $9,200 | $32,947 |
| Paid Search | 120 | 38% | 18% | 4% | $4,100 | $10,742 |
| Paid Social | 80 | 22% | 10% | 2% | $3,200 | $2,867 |
| Referral | 40 | 70% | 48% | 35% | $12,500 | $58,800 |
Paid Social generates 27% of leads but only 2.7% of revenue. Referral generates 13% of leads but 55% of revenue, at a win rate 17x higher than Paid Social. The fix isn't more leads, it's reallocating budget to channels that actually convert.
What to Fix Before Investing More in Acquisition
-
1
Fix retention first
Acquiring a new customer costs 5–25x more than retaining an existing one. If your 90-day churn rate is above 15%, every new customer partially offsets one you're losing. Audit onboarding, define the first value milestone, and get every new customer there within 30 days.
-
2
Fix conversion rate second
Increasing your win rate from 5% to 8% is a 60% revenue increase with zero additional leads. Look at closed lost reasons, identify the top patterns, and address them directly, pricing, demo quality, or qualification criteria.
-
3
Fix channel quality third
Use UTM-to-revenue analysis to identify which channels generate revenue and which generate cost. Reallocate budget from low-win-rate channels to high-win-rate ones.
-
4
Invest in expansion revenue fourth
Existing customers are your highest-converting, lowest-CAC opportunity. Upsell, cross-sell, referral programs, these tend to be underinvested compared to new acquisition, even when the economics are clearly better.
-
5
Only then invest in acquisition
When the funnel converts efficiently and retention is healthy, adding more leads at the top will compound. A 25% win rate and 8% churn mean every new lead has a real shot at becoming long-term revenue.
Before jumping into any of these fixes, it's worth doing a funnel audit first, figuring out which layer is actually the constraint. At LamparaLab I do exactly that: match data across marketing analytics, CRM, and support data, and market signals to map where revenue is leaking between the layers. In most cases it takes one to two weeks, and it almost always changes where the team decides to focus.
FAQ: What Founders Ask About B2B SaaS Funnels
Why are my B2B leads not converting into revenue?
In most cases, the problem lives in the middle or bottom of the funnel, not at the top. Check your closed lost reasons first. That single report will tell you more than any traffic metric.
What are the key B2B SaaS funnel metrics I should be tracking?
The four that matter most: Lead-to-MQL rate, MQL-to-SQL rate, SQL-to-Closed Won rate, and 90-day churn rate. If you don't know all four, you don't yet have enough information to know where to invest.
Can you analyze a B2B SaaS funnel without user-level tracking?
Yes. Without User ID, you work with cohorts, UTM attribution through your CRM, and aggregate time-based correlations between website analytics and CRM data. Perfect attribution is a nice-to-have, not a prerequisite for diagnosis.
When should a B2B SaaS company invest more in lead generation?
When the funnel is converting predictably, retention is healthy, and you know which channels generate the highest-LTV customers. Until then, more leads tend to amplify whatever is already broken. According to Bain & Company research, increasing retention by just 5% can increase profits by 25–95%, making retention a higher-leverage move than acquisition in most cases.
How do I know if lead volume is actually the problem?
Work backwards from your revenue goal. If you need $100K in new MRR, your average deal is $500/month, and your win rate is 10%, you need 200 SQLs, not 2,000 leads. Run this math through your actual funnel conversion rates. In most cases, the math reveals that improving win rate or MQL quality is a faster path to revenue than doubling lead volume.
What's a realistic lead-to-customer conversion rate in B2B SaaS?
For a sales-led B2B SaaS model, overall lead-to-close rates of 2–5% are typical. The biggest variable is channel mix, organic and referral leads convert significantly better than cold paid traffic.
Before you invest more in acquisition, let's check your funnel.
I look at what's happening across all four layers: marketing data, CRM, support signals, and market context. The goal is to figure out where revenue is actually leaking, and then decide where it makes sense to invest.
Book a Call